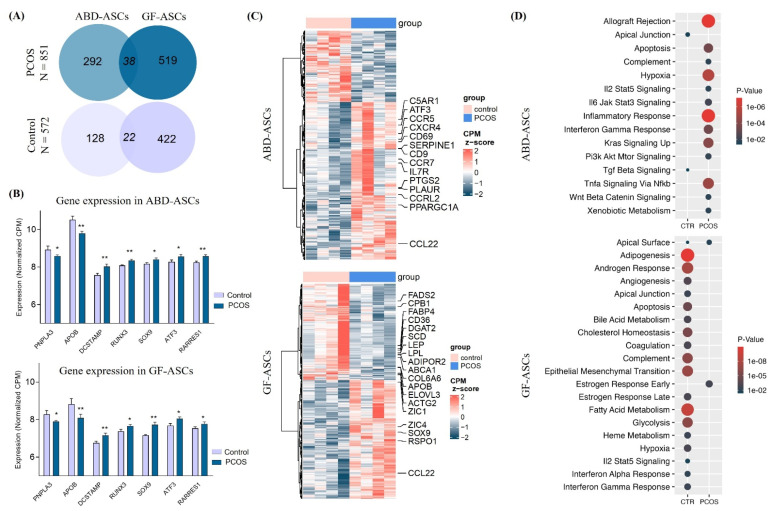
Figure 3.
Effect of PCOS on global gene expression in abdominal (ABD)- and gluteofemoral (GF)-derived ASCs. Differentially expressed gene (DEG) analysis by RNA-seq between ASCs derived from control (n = 4) and PCOS (n = 4). (A) Genes were separated into up (dark blue) and down (light blue) regulation in PCOS vs. control samples. Venn diagrams show the overlap between DEGs found in ABD- and GF-derived ASCs for genes up (top) and down (bottom) regulated in PCOS women. (B) Representation of selected differentially expressed genes in control and PCOS women in ABD-ASCs (top) and in GF-ASCs (bottom). Average normalized CPM values are plotted for each group. * p < 0.05, ** p < 0.01. (C) Heatmaps show the DEGs in ABD-ASCs (left) and in GF-ASCs (right). Key genes are highlighted, and a comprehensive list is shown in Table S1. (D) Functional enrichment analysis performed by HypeR on the genes upregulated in PCOS vs. control in ABD-derived ASCs. Size represents the number of genes found in the respective pathway. Only pathways with p < 0.05 are represented.

