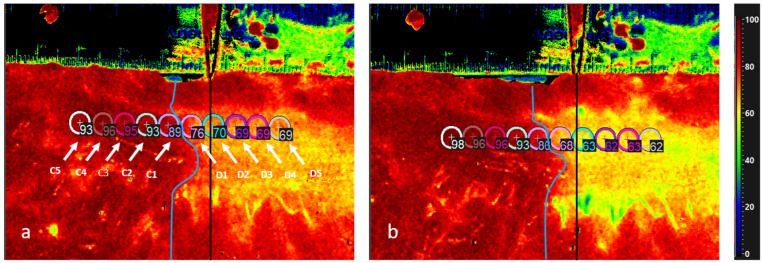
Figure 1.
HSI image for StO2 of the colon with scale bar on the top. The black line (indicated by the scissors) marks the transection line placed by the surgeon, and the blue line illustrates the course of the real border zone. Values of all markers (5 centrally and 5 distally of the border zone) 1 min (a) and 3 min after devascularization (b). D5 is the most distal one and C5 is the most central one. Values distal to the border zone decline while the proximal values increase. The distance between the marked transection line by the surgeon and the real borderline is clearly shown.

