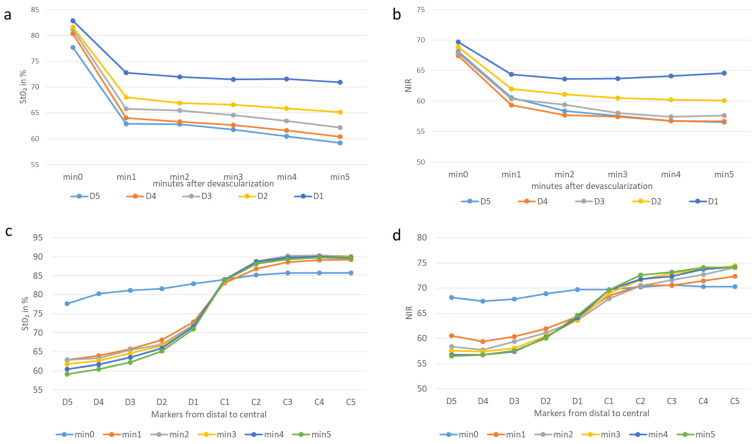
Figure 3.
Graphic illustration of the changes in tissue oxygen saturation and near-infrared perfusion at the different measurement points over time (a) StO2, (b) NIR and along the longitudinal axis of the colon 3 min after devascularization, (c) StO2, (d) NIR. All markers had a diameter of 5 mm and illustrate the value of tissue perfusion. The demarcation line is located between C1 and D1; D5 is the most distal marker and C5 the most central one. a and b illustrate the biggest significant drops distal to the border zone 1 min after devascularization. Illustrations c and d demonstrate the course between the markers and time.

