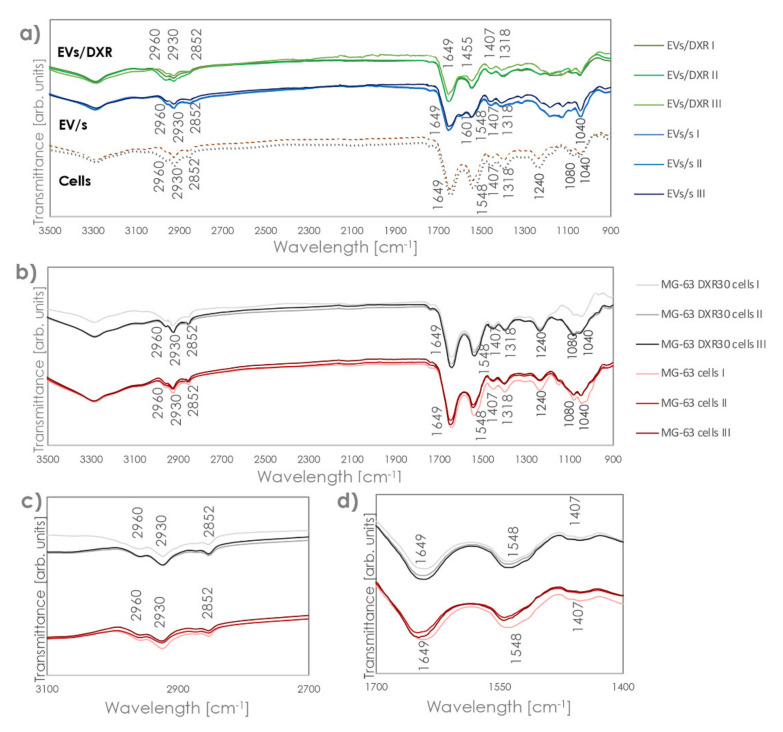
Figure 3.
FT–IR/ATR spectra of EVs/s, EVs/DXR, and cells from which they are derived. (a) FT–IR spectra after subtracting the PBS reference curve of OS cells and OS derived–EVs. (b) FT–IR spectra of OS sensitive and drug-resistant cells. Panels (c,d) highlight the band region corresponding to protein and lipid zones, respectively.

