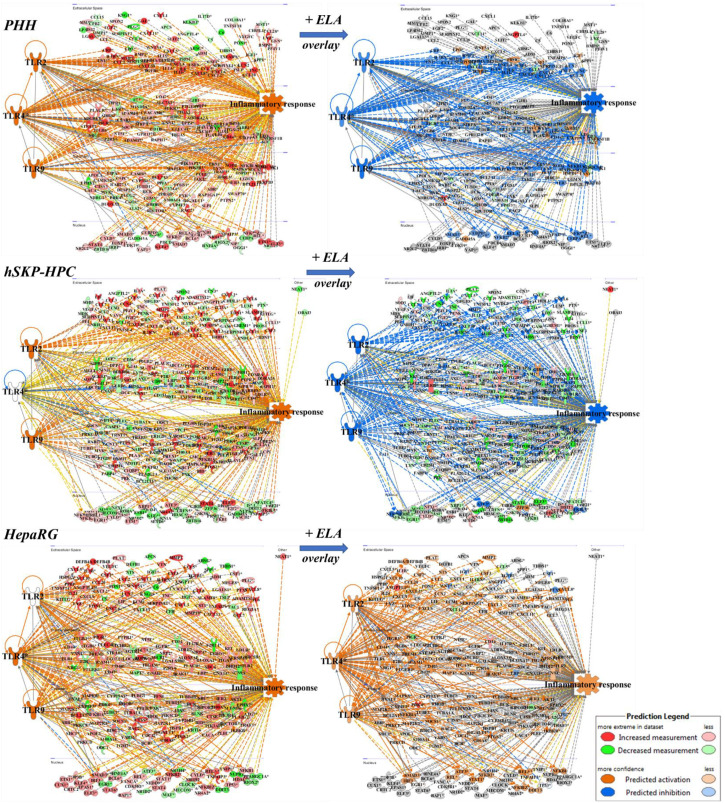
Figure 2.
Pathway analysis predicts a reduction of TLR-2/4/9-dependent inflammatory responses by elafibranor in PHH and hSKP-HPC ‘NASH’ cultures, but not in HepaRG ‘NASH’ cultures. Prediction chart based on TLR signaling shows an activation of inflammatory responses in PHH, hSKP-HPC and HepaRG cell cultures exposed to NASH triggers (left panels). When PHH and hSKP-HPC ‘NASH’ cultures are further exposed to elafibranor, this inflammatory response is inhibited in PHH and hSKP-HPC cell cultures, but not in HepaRG cultures (right panels) [orange line = ‘leads to activation’; blue line = ‘leads to inhibition’; yellow line = ‘findings inconsistent with state of downstream molecule’; grey line = ‘effect not predicted’].

