
Figure 2.
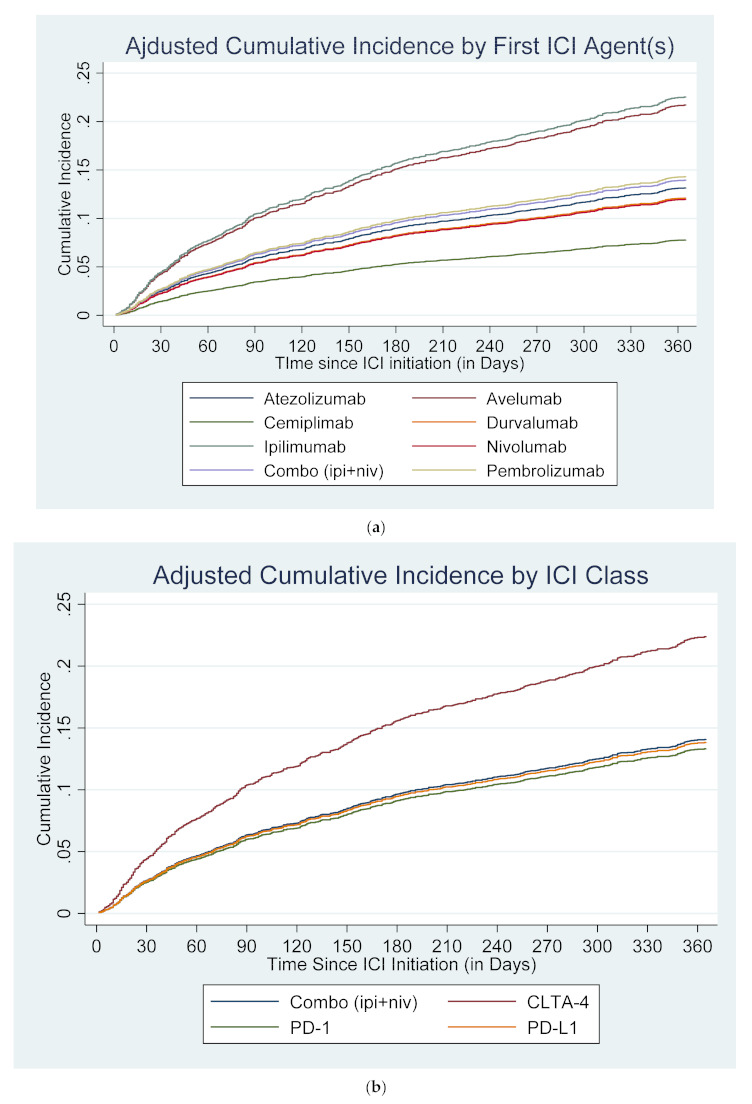
Cumulative incidence of cardiotoxicity after competing risk regressions, adjusted for covariates. (a) By first ICI agent(s), aHR (95% CI). Nivolumab: 1.00 (reference); atezolizumab: 1.11 (0.71–1.72), p = 0.65; avelumab: 1.92 (0.85–4.34), p = 0.12; cemiplimab: 0.64 (0.08–4.75), p = 0.66; durvalumab: 1.01 (0.47–2.16), p = 0.97; ipilimumab: 2.00 (1.49–2.70), p < 0.01; pembrolizumab: 1.21 (1.01–1.46), p = 0.04; combination (niv + ipi): 1.18 (0.85–1.64), p = 0.32. (b) By ICI Class, aHR (95% CI). PD-1: 1.00 (reference); CTLA4: 1.77 (1.34–2.34), p < 0.01; PD-L1: 1.04 (0.74–1.46), p = 0.82; combination (niv + ipi): 1.06 (0.78–1.45), p = 0.71. ICI: immune checkpoint inhibitor; CTLA-4: Cytotoxic T-lymphocyte associated-antigen-4; PD-1: programmed death receptor-1; PD-L1: programmed death-ligand 1; Combo (ipi+niv): combination of ipilimumab and nivolumab; aHR: adjusted hazard ratio; 95% CI: 95% confidence interval.