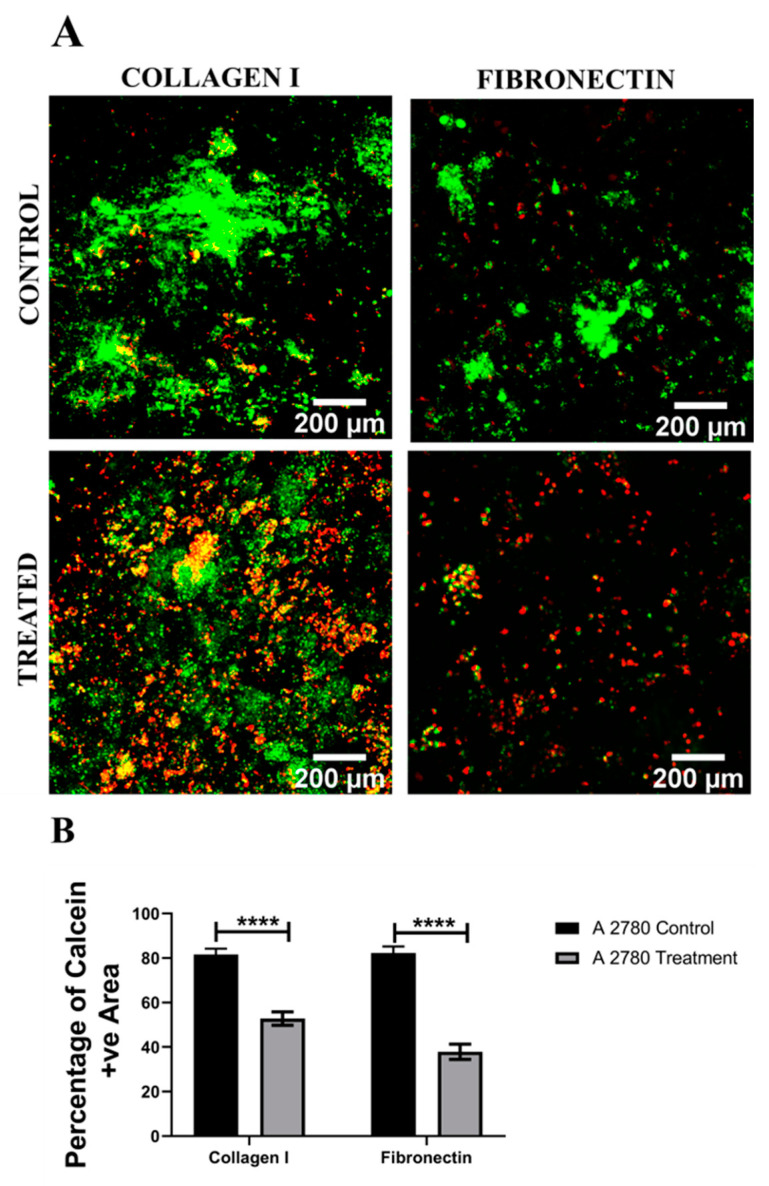
Figure 7.
Effect of the chemotherapeutic Cisplatin on the viability of A2780 EOC cells grown in PU scaffolds of various protein coatings, 24 h post-treatment (A): Representative images for live–dead (green–red) staining in collagen I- and fibronectin-coated treated and untreated (control) A2780 polymeric scaffolds. (B) Image analysis-based quantification of live (green) image areas for A2780 cells grown in collagen I and fibronectin coated polymeric scaffolds. Scale bar = 200 µm. Quantitative data represent mean ± SEM for multiple images (≥3) and multiple scaffolds (≥3). **** p ≤ 0.0001.

