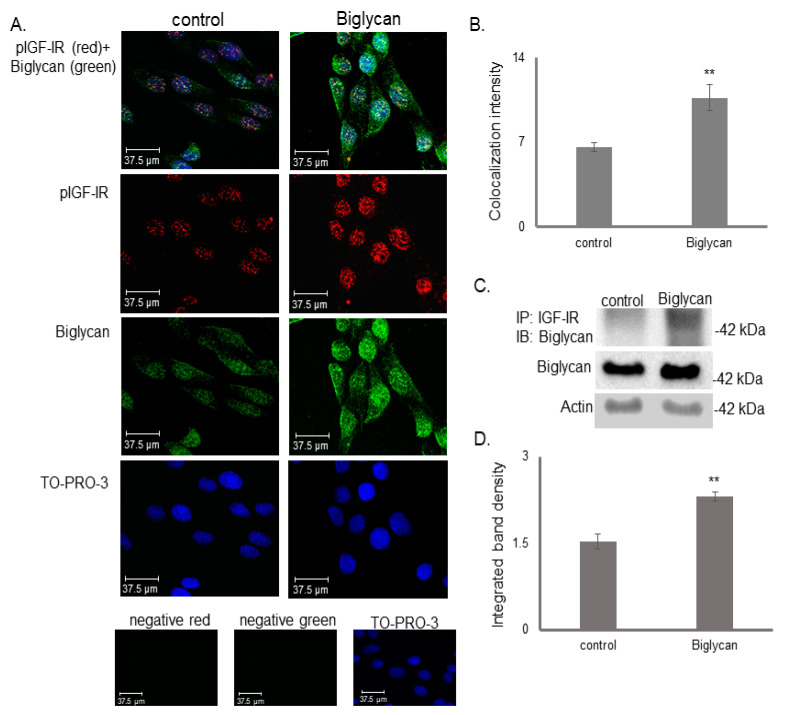
Figure 1.
Co-localization of biglycan and pIGF-IR in MG63 cells. (A) Biglycan (green; anti-rabbit Alexa Fluor 488) and pIGF-IR (red; anti-mouse Alexa Fluor 555) protein staining of cells and respective nuclear staining (using TO-PRO-3) were evaluated in cultures after 48 h in serum-free medium (control) or biglycan (10 μg/mL). Primary antibodies were omitted in negative controls, but both secondary antibodies were used (anti-mouse—negative red; anti-rabbit—negative green). Slides were analyzed by confocal microscopy and pictures were taken using ×40 magnification. (B) Intensity measurement of co-localization of biglycan and pIGF-IR in MG63 cells was calculated using ImageJ Analysis Software. Representative pictures are presented. (C) Control cells were treated with serum-free culture medium, and samples were treated for 48 with biglycan (10 μg/mL). Cells extracts were incubated with IGF-IR antibody overnight in a rotating platform, and IGF-IR complexes were immunoprecipitated with Protein A/G. Western blot analysis was used to visualize biglycan protein immunoprecipitation with IGF-IR. (D) Densitometric analysis of the bands of immunoprecipitated proteins was normalized against the total expression of each protein in the cells and plotted. Representative pictures are presented. The results represent the average of three separate experiments. Means ± S.E.M. plotted; statistical significance is as follows: ** p ≤ 0.01, compared with the respective control samples.

