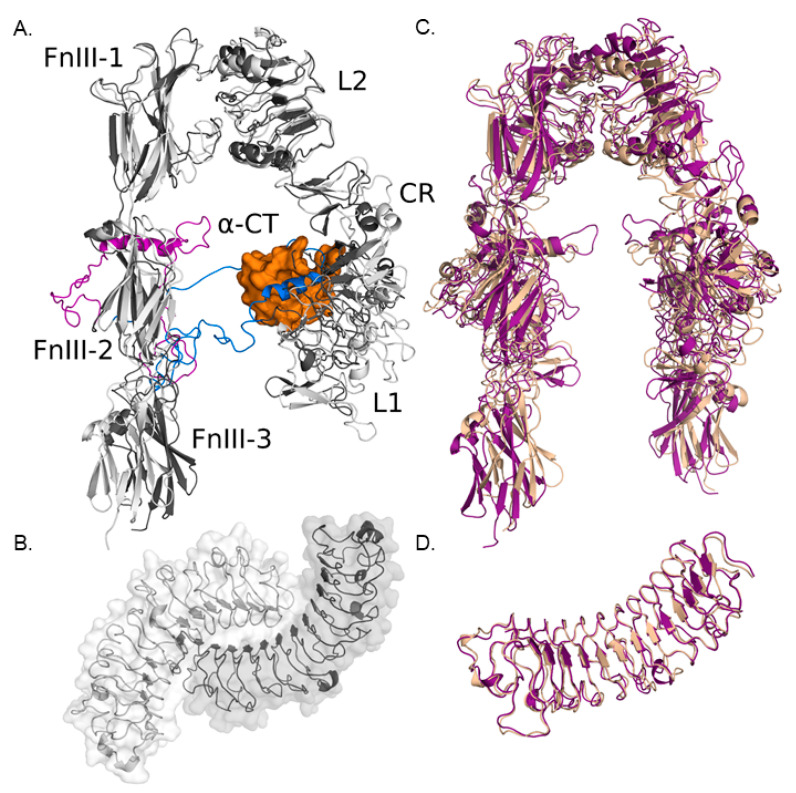
Figure 3.
IGF-IR and biglycan models. (A) Aligned cartoon models of ectodomain monomers of apo-IGF-IR (in grey and purple) and IGF-IR complexed with IGF-I (in white and blue with IGF-I as orange surface). The colored loop regions are homology models from PDB IDs 5U8R and 5U8Q for apo-IGF-IR and IGF-IR complexed with IGF-I, respectively, created with SWISSMODEL [43]. (B) Bovine biglycan dimer (PDB ID 2FT3): the concave core region is unavailable for forming other interactions when biglycan is dimerized. (C,D) Aligned cartoon models of first (sand) and last (purple) frames from the 1 ns MD trajectory of the apo-IGF-IR and the human biglycan monomer models. The structures corresponding to the last frames were submitted to the ClusPro server for docking.

