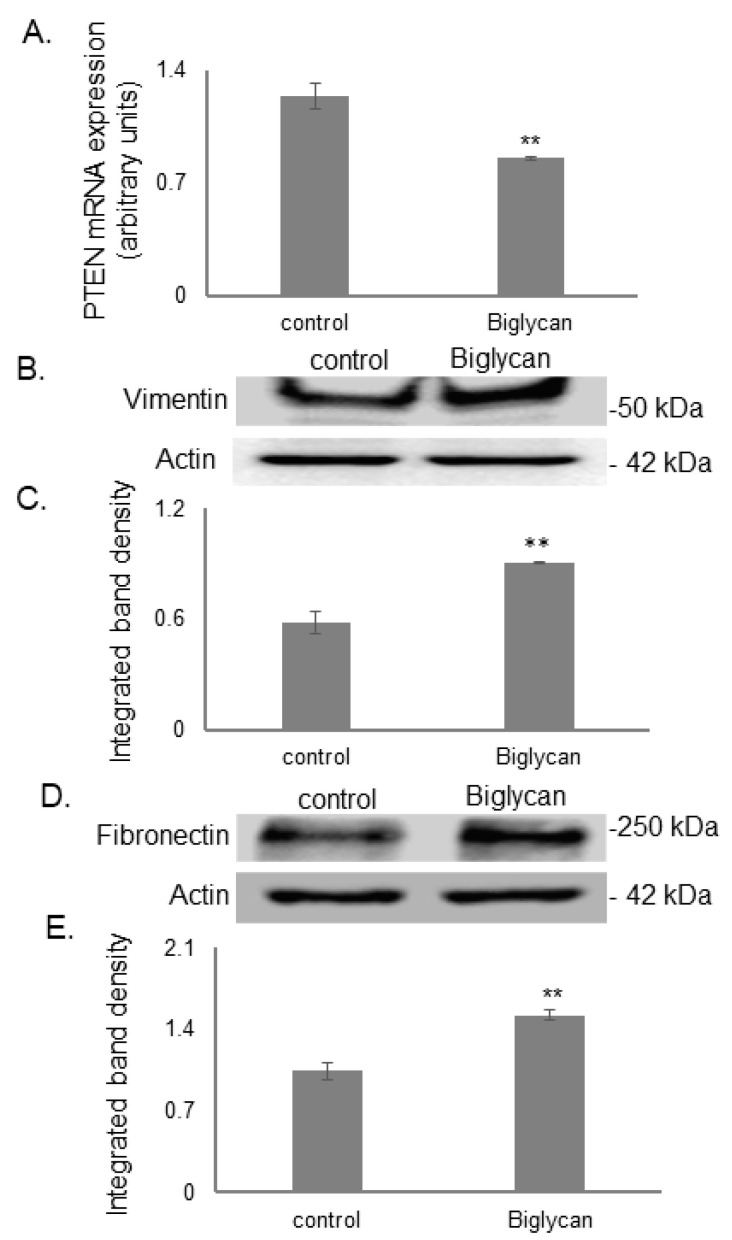
Figure 10.
Effect of biglycan on PTEN expression and aggressiveness markers, vimentin, and fibronectin expression. (A) PTEN mRNA levels in MG63 cells treated with biglycan (10 μg/mL) during 48 h were determined by real time PCR using primers specific for the PTEN gene and normalized against GAPDH. (B) Vimentin and (D) fibronectin in cells treated with serum-free medium (control) and cells treated with biglycan (10 μg/mL) was determined by Western blot analysis. (C,E) Densitometric analysis of the protein bands of vimentin and fibronectin were normalized against actin and plotted. Representative blots are presented. Results represent the average of three separate experiments. Means ± S.E.M were plotted; statistical significance: ** p ≤ 0.01, compared with the respective control samples.

