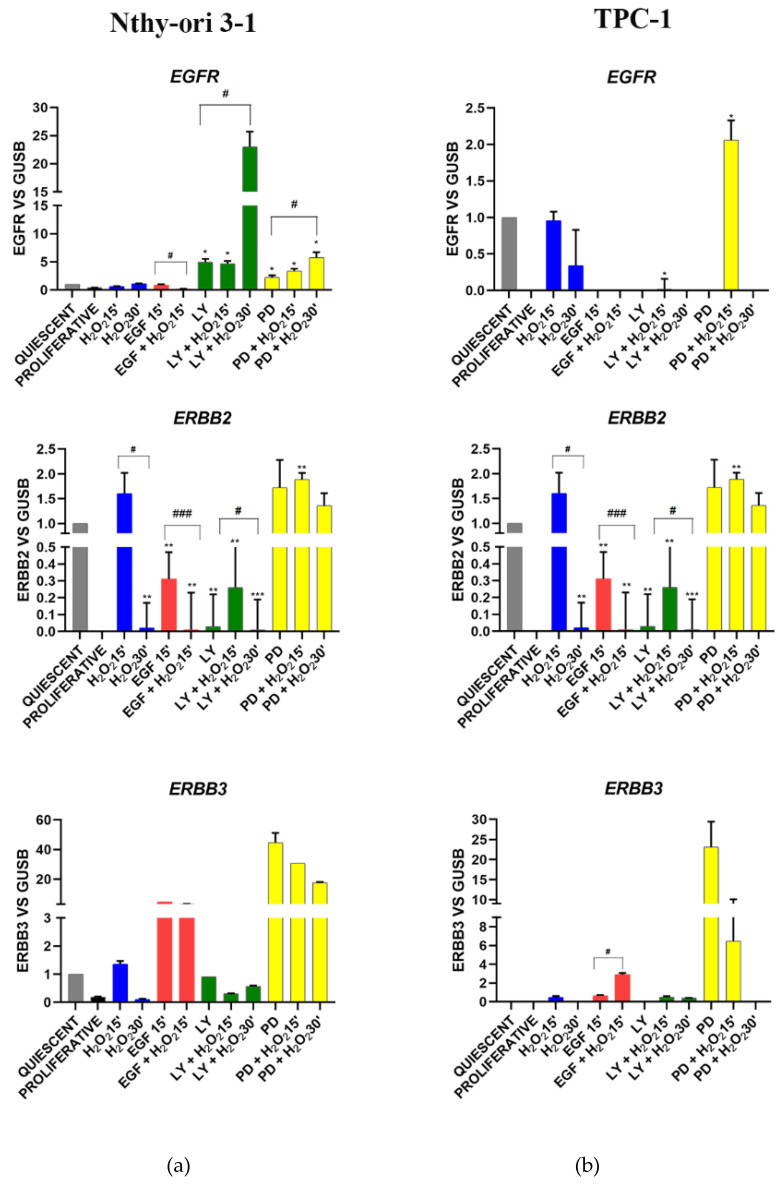
Figure 4.
EGFR (epidermal growth factor receptor, ERBB2 (Erb-B2 receptor tyrosine kinase 2), ERBB3 (Erb-B3 receptor tyrosine kinase 3) gene expression modulation under H2O2, EGF, LY and PD treatments alone and combined in Nthy-ori 3-1 cells (a) vs. TPC-1 cells (b). Gene expression was analyzed by Real-time qPCR. The histogram represented normalized data with GUSB gene, and the results showed the average of three independent experiments. LY—LY294002; PD—PD98059; *—p < 0.05, **—p < 0.01 ***—p < 0.001 treated vs. quiescent cells; #—p < 0.05, ###—p < 0.001 cells with similar treatment.

