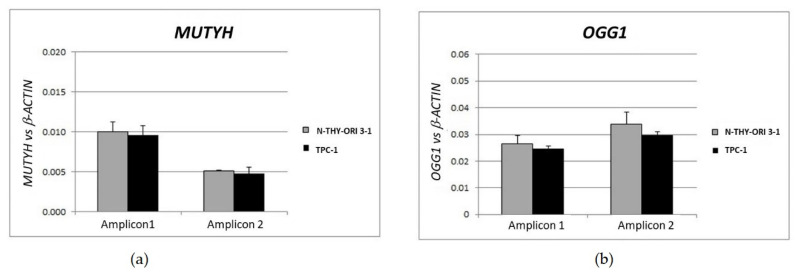
Figure 7.
MUTYH and OGG1 gene dosage. (a) Nthy-ori 3-1 cells, (b) TPC-1 cells. Gene dosage was performed by SYBR Green qRT-PCR. For both genes were selected two different genomic sequences. The samples were amplified in triplicate in three independent experiments. The gDNA amounts of the target genes were normalized by the ratio on median value of the b-Actin genomic reference gene from TPC-1 vs. Nthy-ori 3-1.

