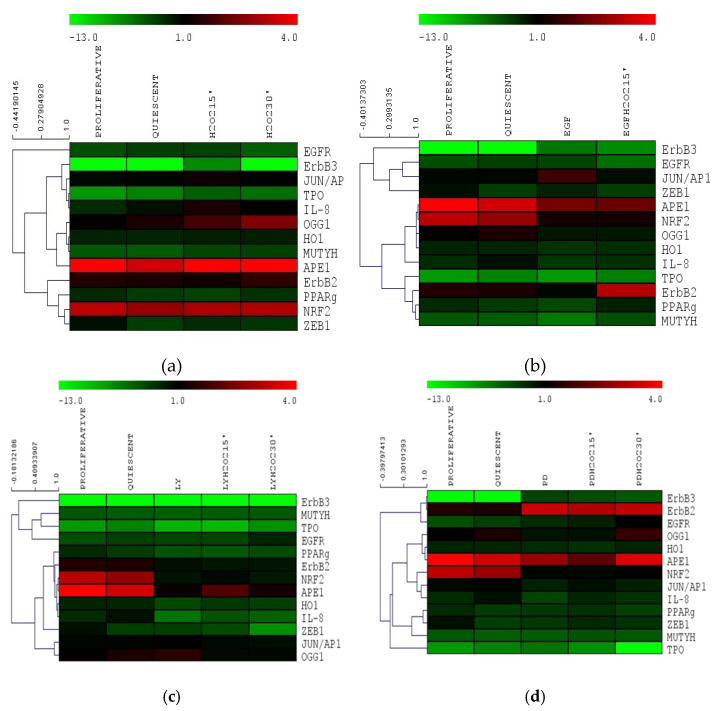
Figure 8.
Gene expression cluster analysis by MeV4.9.0 in Nthy-ori 3-1 cells: (a) H2O2 treatments; (b) EGF treatments; (c) LY treatments; (d) PD treatments. The average linkage hierarchical clustering with Pearson correlation was used. The color scale at the top represents the log2 of every single gene expression value compared with housekeeping value ranging from −13 (green) to 4 (red). The trees presented here are the neighbor-joining trees based on gene expression variation in response to different treatments. LY—LY294002; PD—PD98059.

