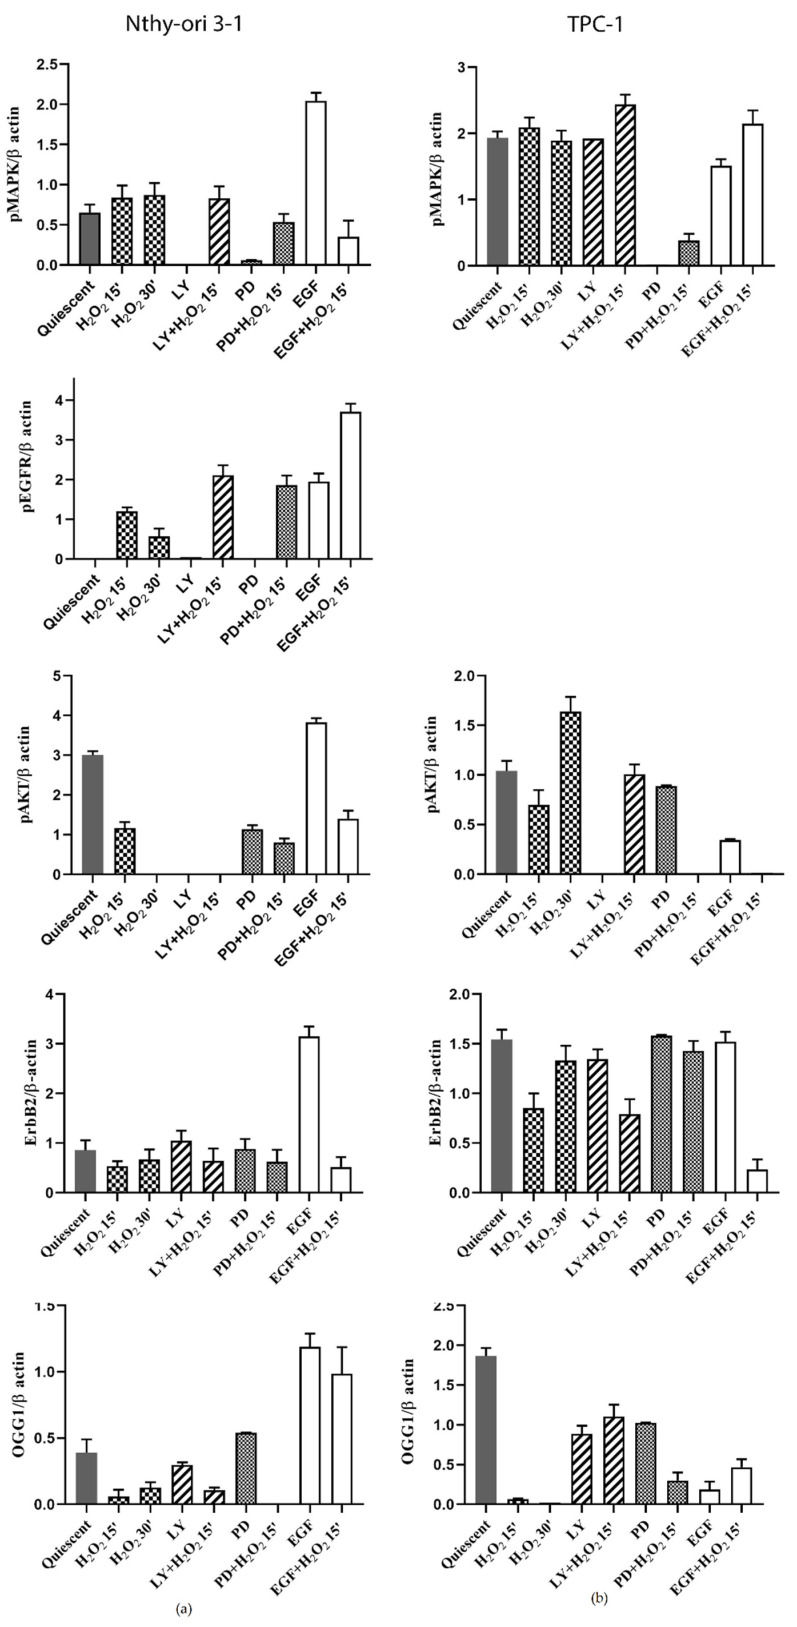
Figure 10.
Protein expression quantification of ErbB pathway NThy-ori 3-1 vs. TPC-1 cells. Quantification of selected proteins (p-EGFR, ErbB2, p-MAPK, p-AKT) detected by WB in Nthy-ori3-1 and TPC-1 (Figure 9a,b). The expression of p-EGFR, was undetected in TPC-1 cells. The average expression levels of panel (a) and panel (b) were determined by densitometric analysis and calculated in relation to the β-Actin level. Quiescent cells were treated with H2O2 and LY, PD, EGF alone or combined. LY—LY294002; PD—PD98059.

