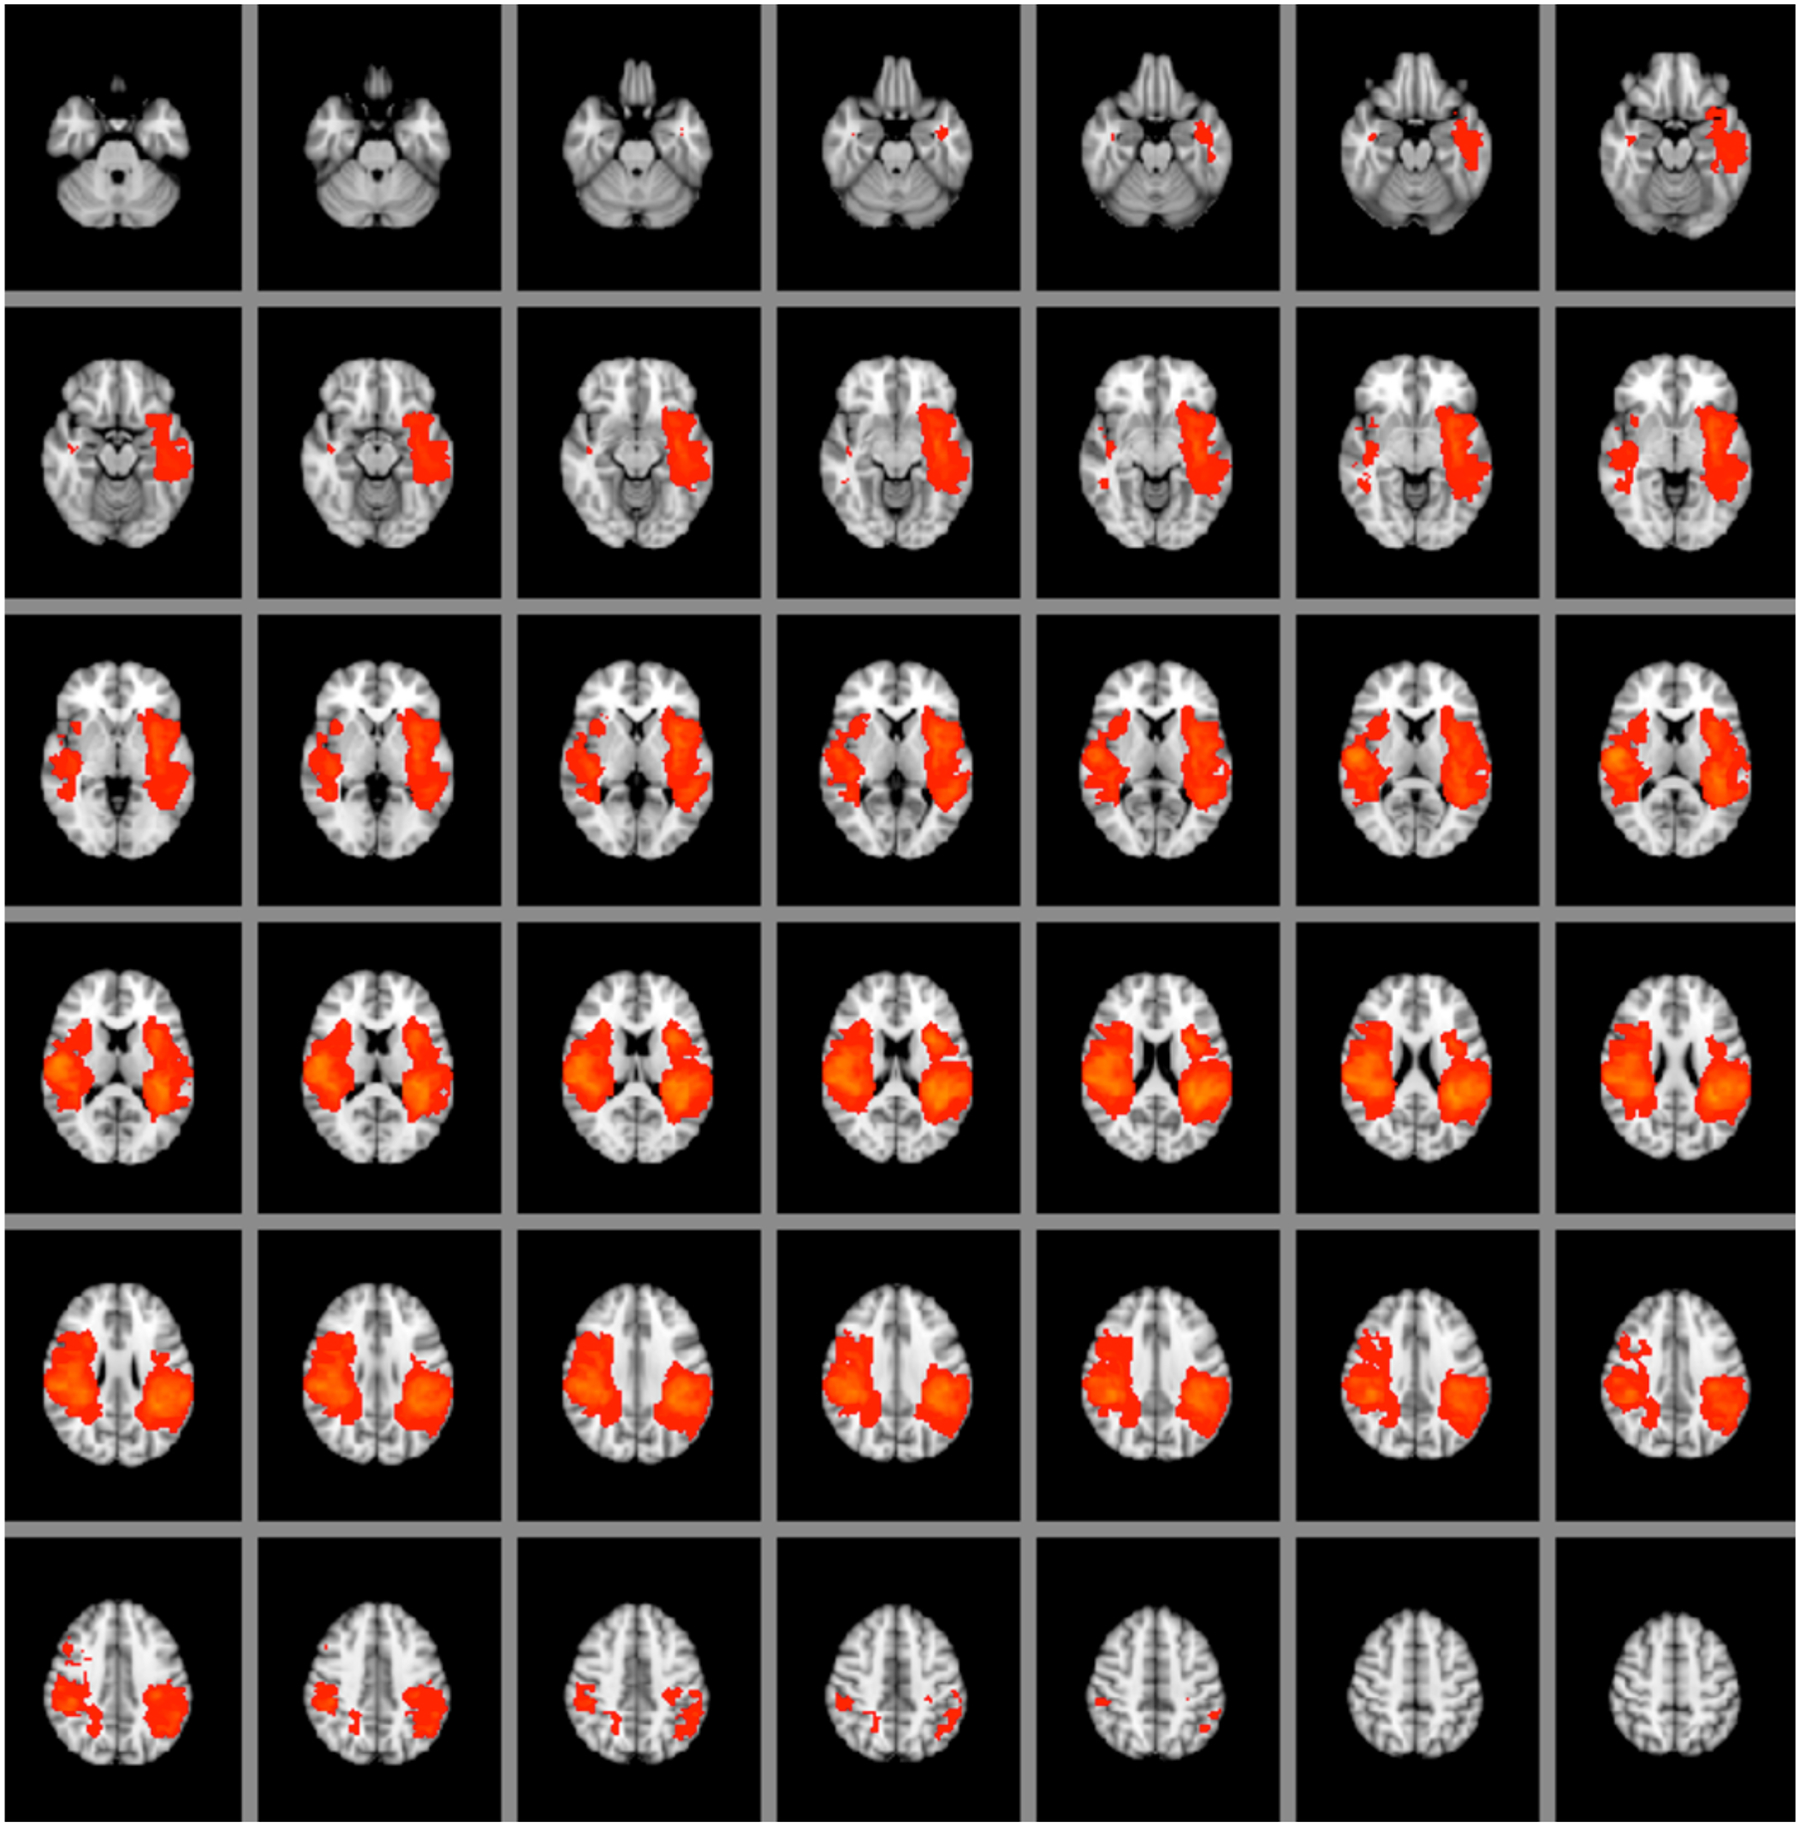
FIG. 2.

Tumor heat map showing the locations of left and right brain tumors. We set the minimum number of tumor overlaps to 15 and the maximum number of overlaps to 30. The left hemisphere is seen on the right side of each brain slice, and the right hemisphere is seen on the left side of each brain slice.
