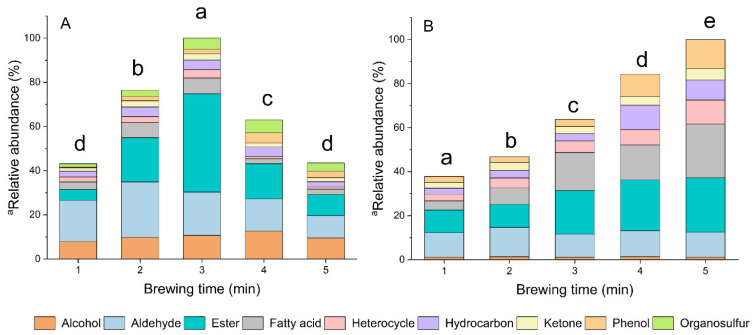
Figure 1.
Main contribution groups of compounds shown by the relative abundance. Percentage is the ratio of total peak area of each group to the total peak area of all groups. (A) Relative abundance of VOCs in headspace; (B) relative abundance of compounds (without alkaloid group) in tea infusion. Different lower-case letters indicate significant difference (p < 0.05).

