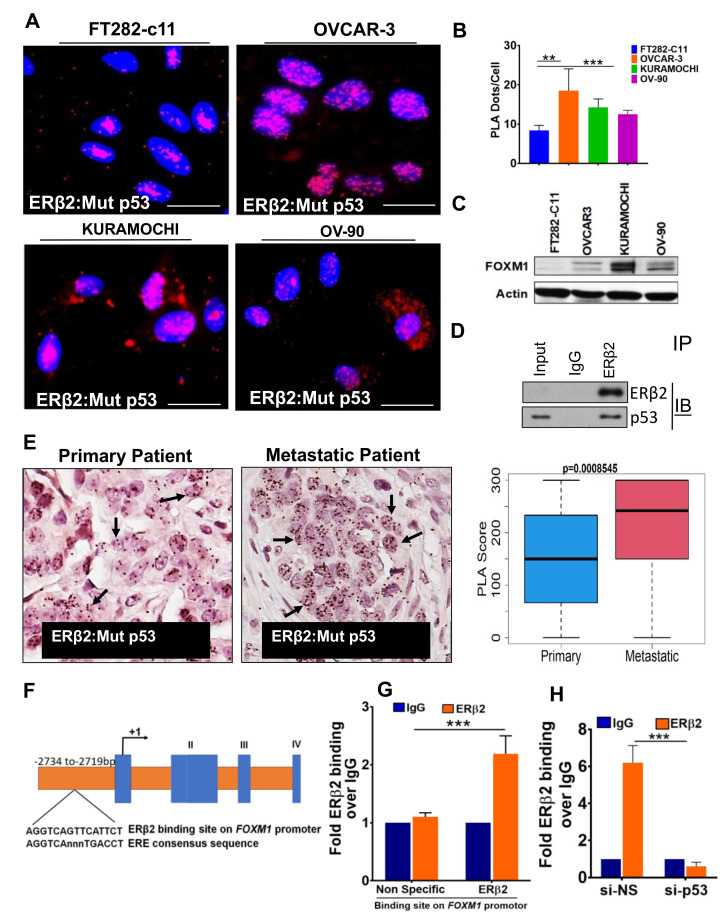
Figure 3.
ERβ2 and mutant p53 physically interact and are recruited to the FOXM1 gene promoter leading to activation of transcription. (A) ERβ2-p53 interaction was analyzed by proximity ligation assay (PLA) in FT282-c11, OVCAR3, KURAMOCHI, and OV90 cells. Scale bar = 20 µm. (B) Quantification of PLA dots by ImageJ software. Statistical analysis was performed on average number of dots (per 300 nuclei) in three independent experiments. Error bar represents SD and p values were analyzed using ANOVA test. ** = 0.001, and *** = <0.0001. (C) Immunoblot showing expression of endogenous FOXM1 in HGSOC cells. (D) Co-immunoprecipitation (Co-IP) of endogenous ERβ2 and mutant p53 was performed in OVCAR3 cells followed by immunoblotting with p53 and ERβ2 antibodies. (E) ERβ2–mutant p53 interaction in primary versus peritoneal metastatic HGSOC patient tumors on TMAs were assayed by Bright-field PLA. Representative images are shown. Quantification (by t-test) of PLA scores for ERβ2–mutant p53 interaction in primary versus peritoneal metastatic HGSOC patient tumors are shown on the right. PLA dots in 300 nuclei per patient tissue core in the TMA were manually counted using Bright-field microscopy. PLA scores >100 represent high interaction and dots <100 represent low interaction. (F) Schematic diagram of FOXM1 gene promotor with ERβ2-binding site. (G) Quantitative chromatin immunoprecipitation (qChIP) with ERβ2-specific antibody or IgG (negative control) on FOXM1 promoter was performed in OVCAR3 cells with or without depletion of ERβ2 for 48 h. (H) OVCAR3 cells transiently transfected with non-specific siRNA (si-NS) or TP53-specific siRNA. 48 h post-transfection, qChIP for ERβ2 or IgG (negative control) on FOXM1 promoter was performed. Statistical analysis for data in Figure 3G, H was performed based on three independent experiments. Error bar represents SD and p values were analyzed using an unpaired Student’s t-test. *** = <0.0001. The uncropped Western Blot images can be found in Figure S10.

