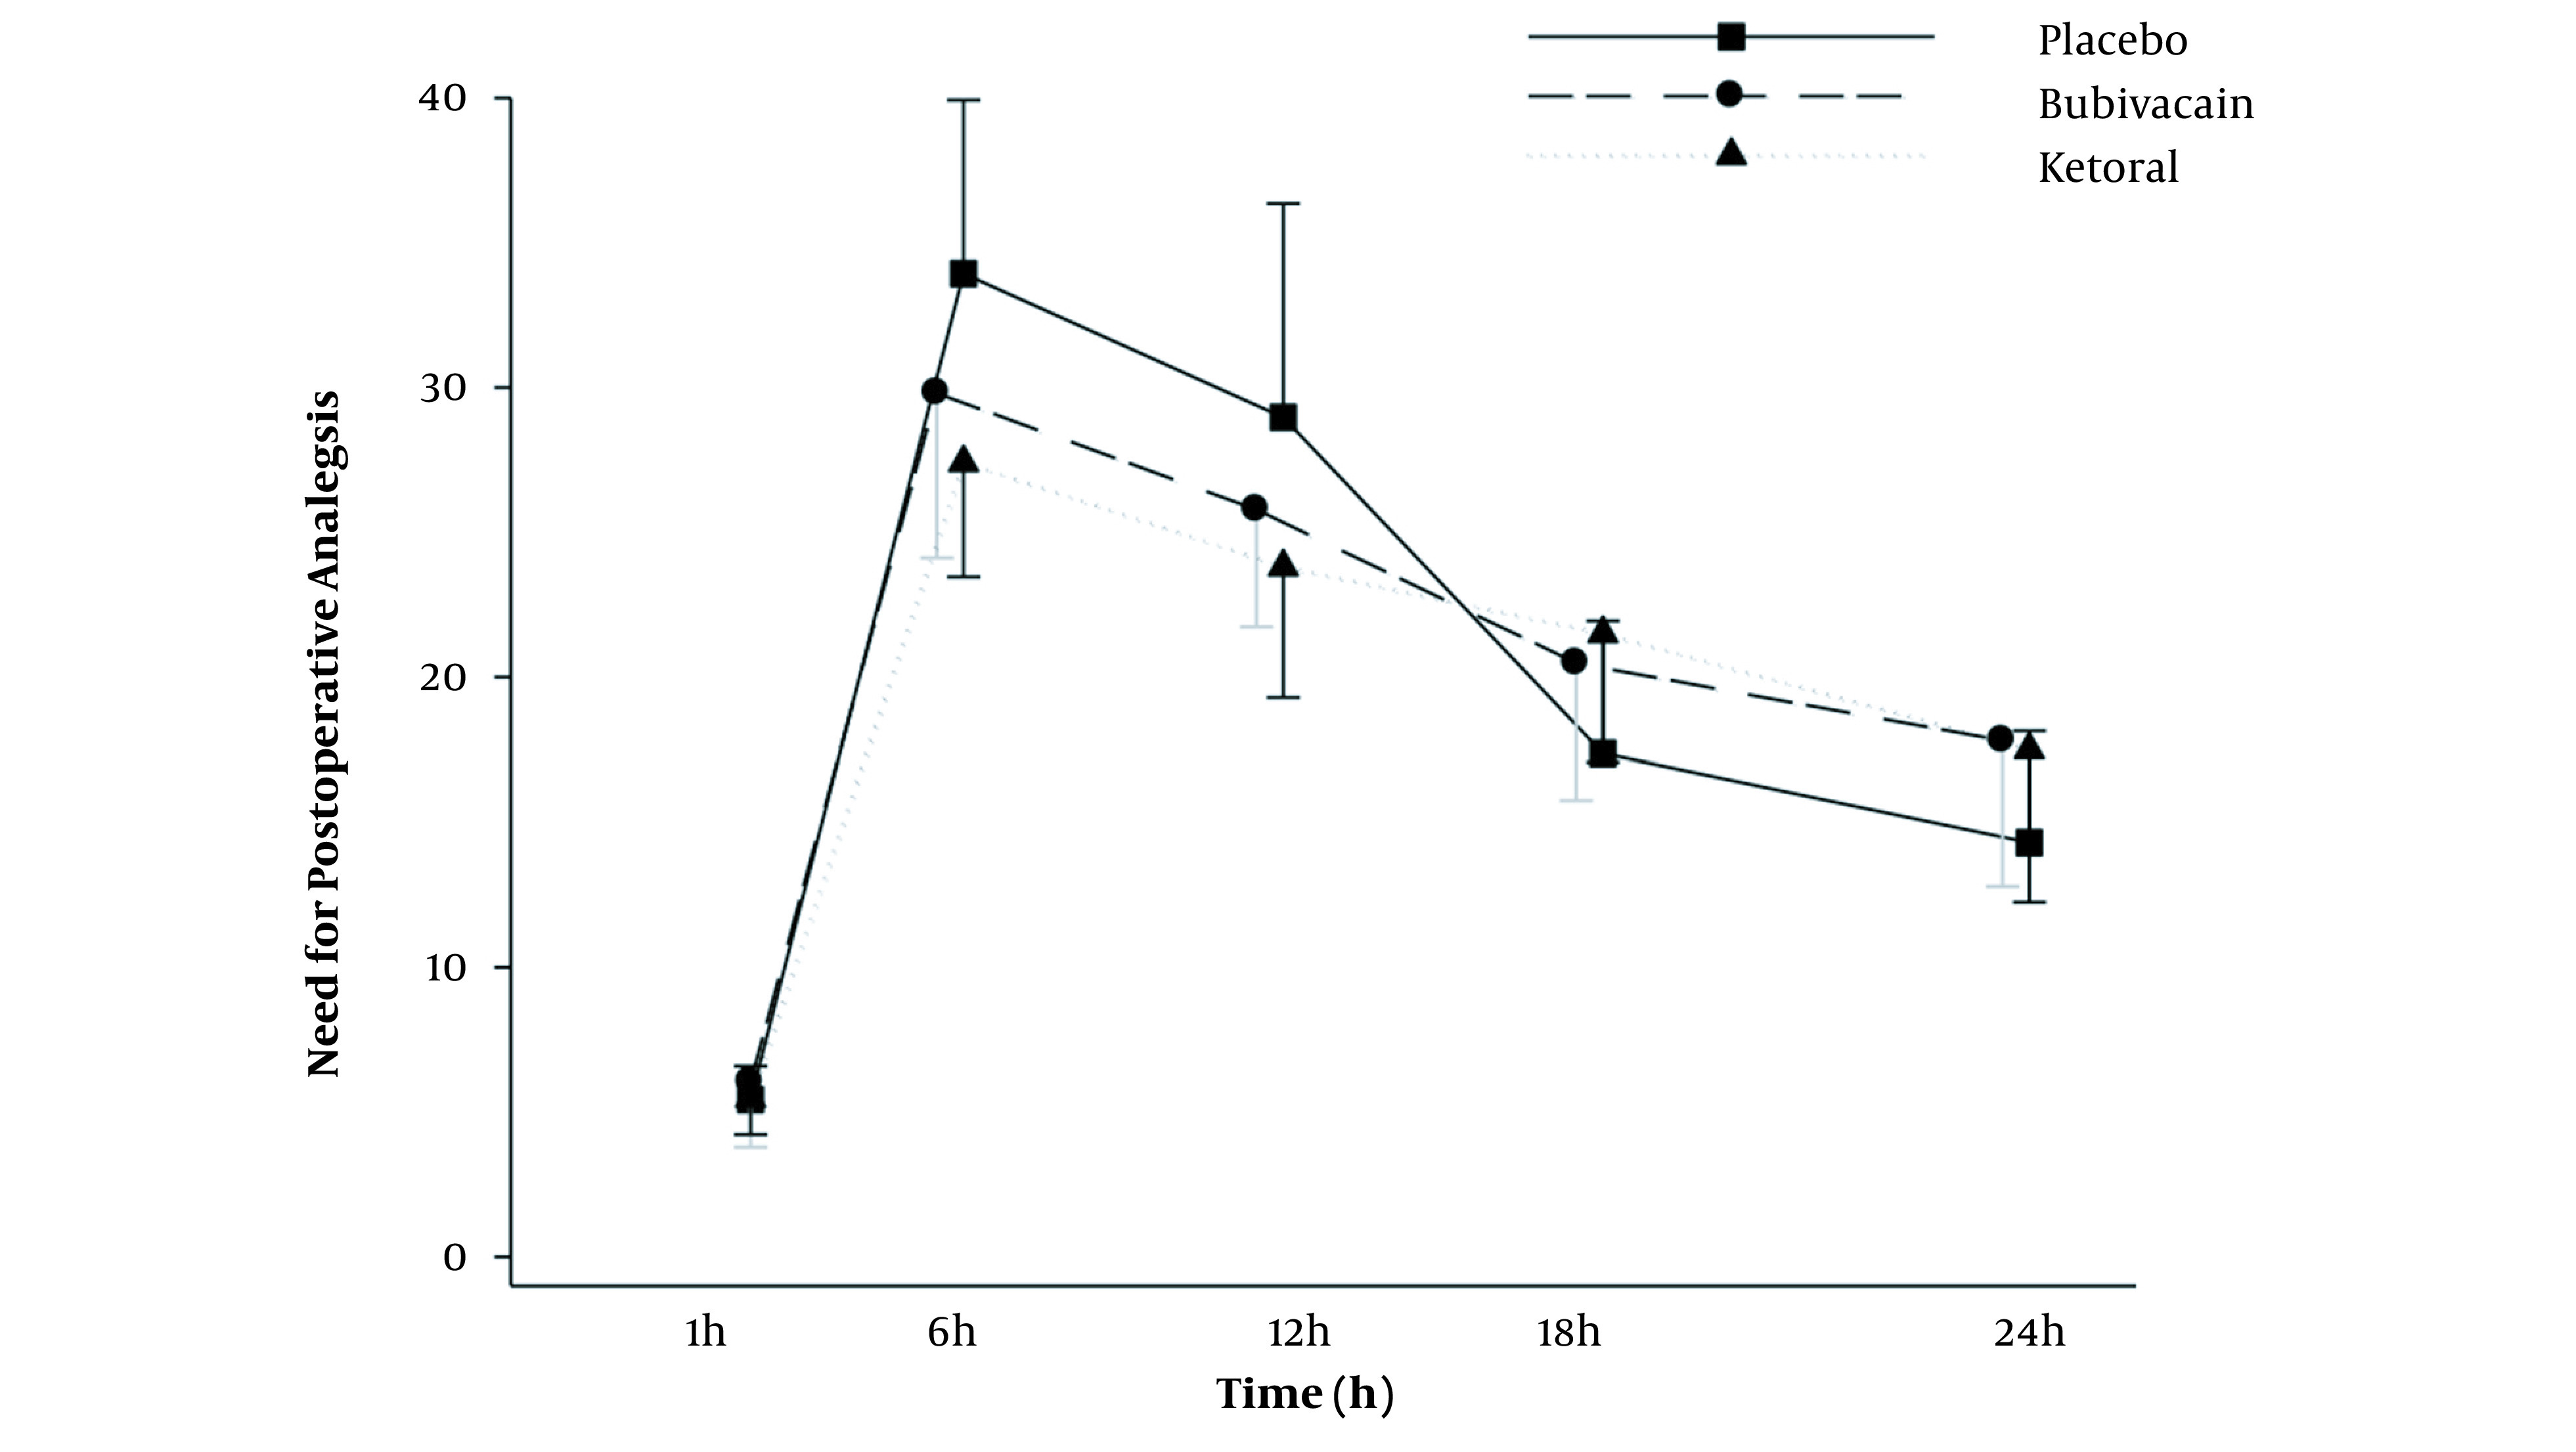
Figure 5. Comparison of the postoperative analgesic consumption in the experimental groups at postoperative times. Values are represented as the number of frequency. Differences between the results of the placebo group and other groups (*** P < 0.001; n = 30 for each group).

