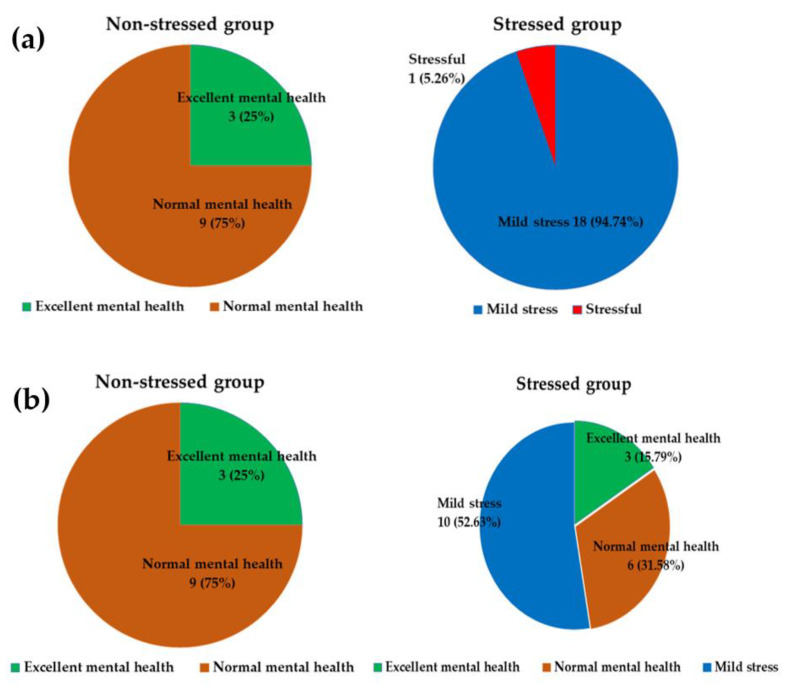
Figure 2.
Stress status of the stressed and non-stressed groups (numbers of subjects (%)). The different color denotes each stress status. Green: Excellent mental health; Orange: Normal mental health; Blue: Mild stress; Red: Stressful. (a) Stress status at baseline, (b) Stress status after 12 weeks.

