Figure 3.
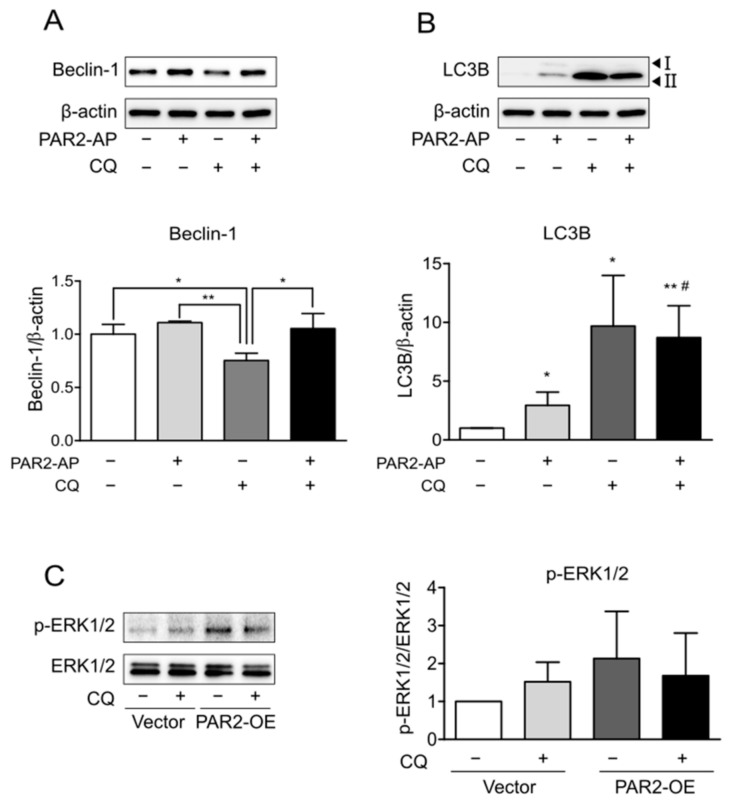
The protein level of p-ERK1/2 was reduced by autophagy inhibition. Caco-2 cells were serum-starved for 24 h and treated with PAR2-AP (100 µM) or CQ (100 µM) for 24 h. β-actin was used as the loading control. The column bar graph signifies the ratio of each protein to β-actin. Data are shown as mean ± SD. (A) Western blotting was used to measure the protein level of beclin-1. * p < 0.05, ** p < 0.01 with one-way ANOVA. (B) The expression of LC3B was detected using Western blotting. * p < 0.05, ** p < 0.01 compared to the control group; # p < 0.05 compared to the PAR2-AP group (one-way ANOVA). Caco-2 cells were transfected with vector plasmid and PAR2-OE plasmid for 48 h and then treated with CQ (100 µM). (C) Western blotting was used to detect p-ERK1/2 protein in PAR2-OE cells. The bar graph indicates the ratio of p-ERK1/2 to ERK1/2. Data are shown as mean ± SD.

