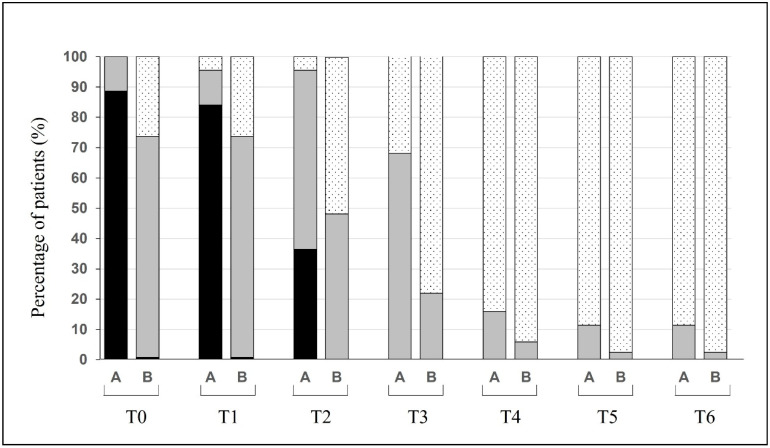
Figure 4.
Changes over time of the percentage of patients (group A: anosmic; group B: hypo- and normosmic) suffering from different degrees of taste dysfunctions and their evolution over time. A: group A; B: group B. Ageusia (black, VAS ≥ 7), hypoageusia (gray, 1 ≤ VAS < 7), and normosmia (dotted, VAS < 1).

