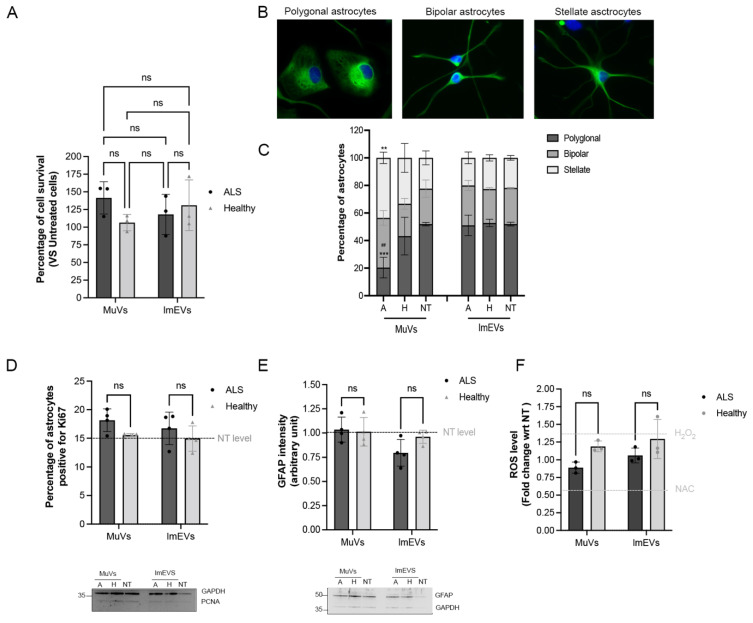
Figure 4.
Effects of MuVs or lmEVs on astrocytes. (A) Quantification of astrocyte survival following treatment with EVs secreted by the myotubes of ALS or healthy subjects. (B) Representative images of astrocyte shapes. Green: GFAP staining, blue: DAPI. (C) Distributions of astrocyte shapes when treated or not with MuVs (NT-M = non-treated, H-M = treated with Healthy MuVs, A-M = treated with ALS MuVs) or with lmEVs (NT-L = non-treated, H-L = treated with Healthy lmEVs, A-L = treated with ALS lmEVs), (n = 4 per treatment). **, p < 0.01, ***, p < 0.001, significantly different from NT, ##, p < 0.01, significantly different from Healthy MuV values, ns: non-significant. Plots are shown for (D) percentage of Ki67 positive astrocytes, (E) measurement of GFAP intensity in astrocytes, and (F) quantification of ROS production in rat astrocytes, following treatment with MuVs (ALS or Healthy) or lmEVs (ALS or Healthy) (n = 3–4 per treatment). Dotted lines indicate levels for untreated cells or in (D) for H2O2 positive control and NAC (N-acetyl cysteine) negative control. Lower panels: representative Western blots showing (D) the low expression level of PCNA in astrocytes, and (E) the constant expression level of GFAP in astrocytes, regardless of treatment; ns—non-significant.

