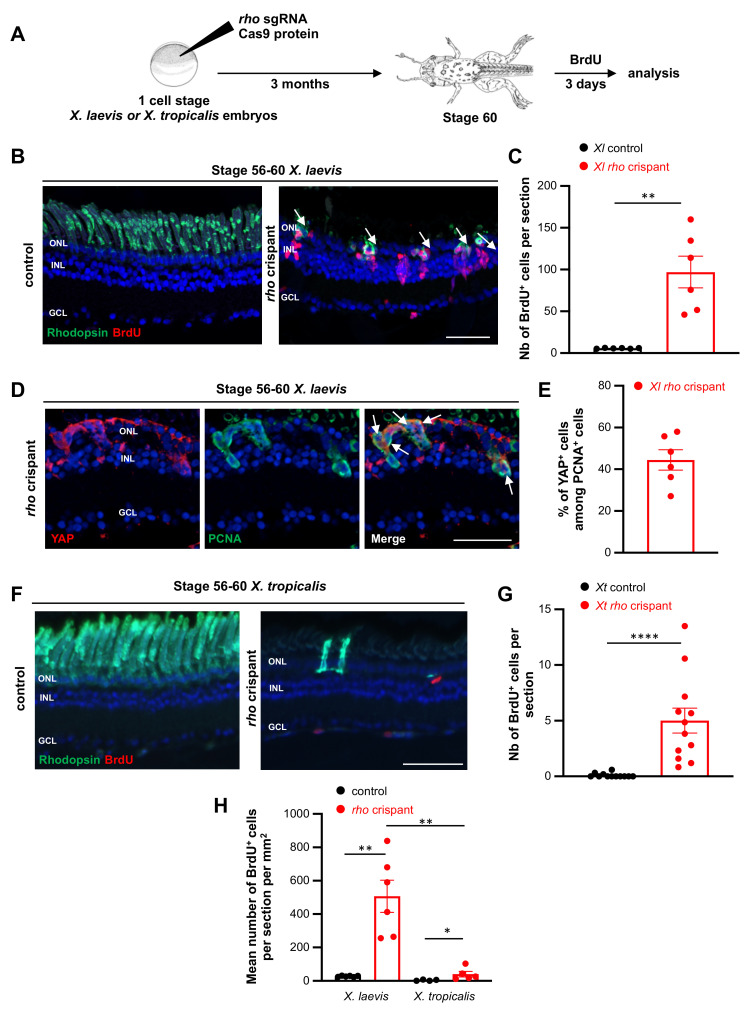
Figure 6.
Analysis of proliferation in X. tropicalis and X. laevis rho crispants. (A) Timeline diagram of the experimental procedure used in (B–H). (B,C) BrdU assay on retinal sections from stage 56–60 control and crispant X. laevis tadpoles. Sections were co-labelled for Rhodopsin. Arrows point to double positive cells. BrdU-positive cells are quantified in (C). (D) Typical sections from stage 56–60 crispant X. laevis tadpoles, immunostained for PCNA (a marker of proliferative cells) and YAP (a marker of Müller cells). Arrows point to double positive cells. (E) Quantification of proliferating Müller cells (YAP- and PCNA-positive). (F,G) BrdU assay on retinal sections from stage 56–60 control and crispant X. tropicalis tadpoles. Sections were co-labelled for Rhodopsin. BrdU-positive cells are quantified in (G). (H) Comparison of BrdU incorporation between X. laevis and X. tropicalis crispants at stage 56–60. The number of BrdU-positive cells was normalized to retinal cell surface. In (B,D,F) cell nuclei are counterstained with Hoechst (blue). In (C,G), counting was performed in the central retina, considering only the inner and outer nuclear layers. In graphs, data are represented as mean ± SEM and each point represents one retina. * p < 0.05; ** p < 0.01; **** p < 0.0001 (Mann–Whitney tests). GCL: ganglion cell layer, INL: inner nuclear layer, ONL: outer nuclear layer. Scale bars: 50 µm in (B,F), 25 µm in (D).

