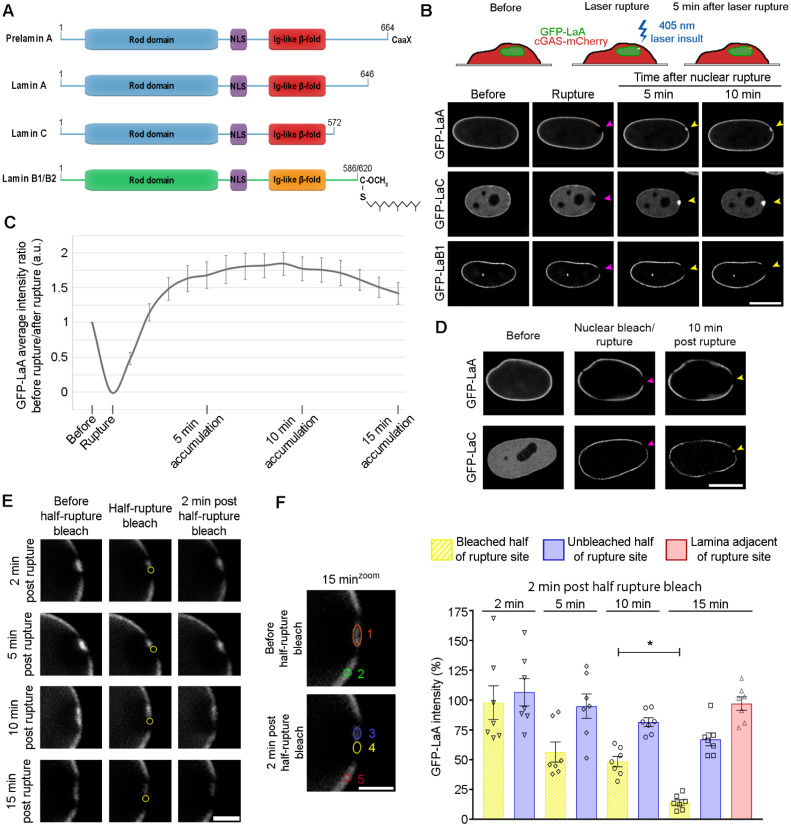
Figure 1.
Mobile A-type lamins accumulate at nuclear ruptures and gradually become immobile. (A) Linear models of lamins that highlight important features of the proteins, including the coiled-coil rod domain, the nuclear localization sequence (NLS), and the Ig-like β-fold. B-type lamins and preLaA are farnesylated, whereas mature LaA and LaC are not. (B) A 405 laser is used to induce nuclear rupture at a precise location on the nuclear envelope. BJ-5ta cells stably expressing GFP-tagged LaA, LaC, or LaB1 after a laser-induced nuclear rupture (purple arrowheads) were imaged for 10 min to monitor for protein accumulation at the rupture sites (yellow arrowheads). Scale bar, 10 μm (C) Graphical representation of the ratio of GFP-LaA intensity prior to and following the laser-induced nuclear rupture in stably expressing BJ-5ta cells. All values are normalized to an adjacent site on the nuclear envelope to account for photobleaching during image capture. The graph represents mean values ± SEM (n = 8 cells). (D) Representative images of BJ-5ta cells expressing either GFP-LaA or GFP-LaC had their nucleoplasmic GFP signal photobleached, then underwent laser-induced nuclear rupture (purple arrowheads) and were imaged for 10 min to assess protein accumulation (yellow arrowheads). Scale bar, 10 μm. (E) GFP-LaA mobility at ruptures sites was determined at time points 2, 5, 10, and 15 min post laser-induced rupture by bleaching half of the rupture for 5 s (yellow circle), then waiting 2 min before measuring changes in GFP-LaA intensity within the two rupture halves. Scale bar, 2 μm. (F) Quantification of GFP-LaA intensity at rupture sites were performed 2 min after half-rupture bleaches at 2, 5, 10 or 15 min. The average intensity of LaA was measured at each time point before a 5 s half-rupture bleach (orange circle 1) and again 2 min later in either the bleached half (yellow circle 4) or unbleached half (blue circle 3) of the rupture. The ratio of the 2 min post half-rupture bleach to before the half-rupture bleach was calculated and shown as a percentage for each the bleached half and unbleached half of the rupture. The adjacent lamina intensity at 15 min was determined by calculating the ratio before the half-rupture bleach (green circle 2) to 2 min post half-rupture bleach (red circle 5). All values were normalized to the fluorescence of a region on the lamina on the opposite side of the nucleus from the nuclear rupture at the corresponding time points. The graph represents mean values ± SEM and includes individual values (n = 7 cells for each time point; *, p = 0.0298 by a two-way ANOVA with Tukey’s post hoc multiple comparison test).

