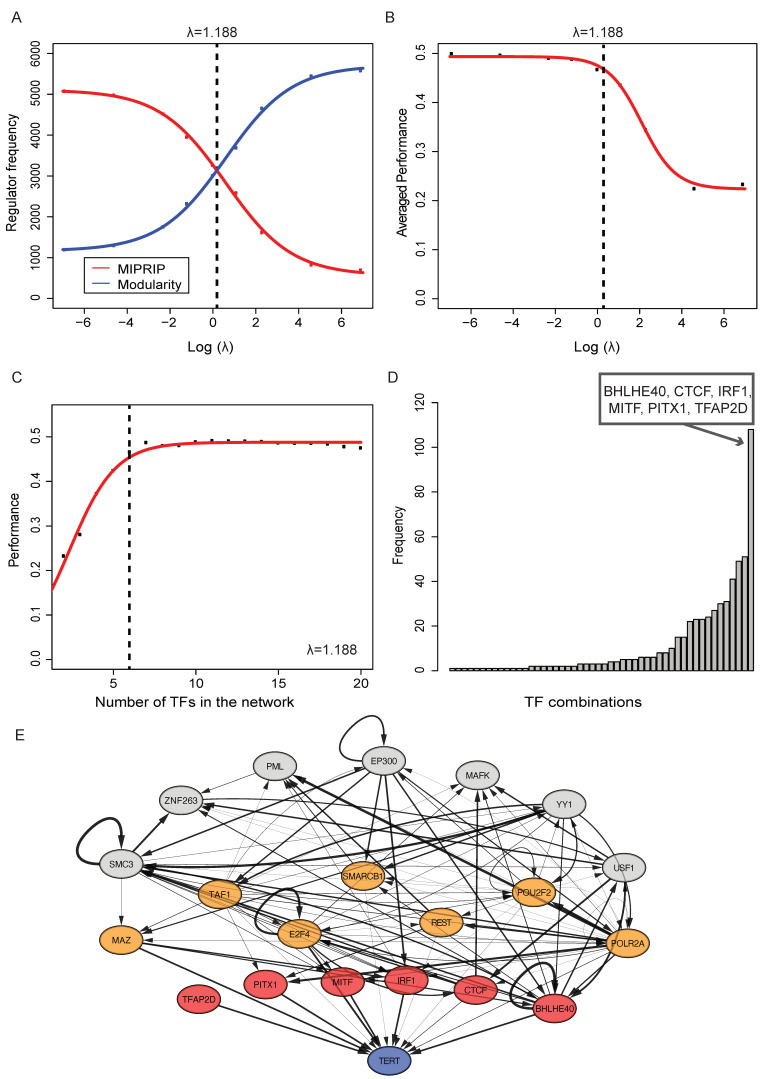
Figure 1.
Optimization of λ and the identified regulatory module. (A) The sum of selected TF from the MIPRIP model (direct TF, red curve) and from the modularity model (indirect TF, blue curve) over all models for different λ values. The total number of direct and indirect TF to be selected by the models was 6270 for each λ value (from 30 repeated cross-validations, in which each repeat consisted of models from 2 to 20 TF). The intersection of both curves led to the optimal λ value. (B) The performance over all models for different λ values. The dashed line indicates the value for the optimal λ. (C) Shown is the performance of the models with the optimal λ. At least six TF are necessary to obtain a good prediction of TERT expression. (D) This histogram shows which combination of TF was used most often over all models. The most often combination was BHLHE40, CTCF, IRF1, MITF, PITX1, and TFAP2D. (E) The identified gene regulatory network for TERT regulation in PCa, predicted direct regulators of TERT are marked in red. TF added by the modularity approach are marked in orange if they were known to bind to the TERT promoter and in grey if they only bind to the indirect regulators of TERT. The width of the edges between the significant and putative regulators and TERT is based on their weights in the generic regulatory network. The width of the interactions between the regulators was derived by the correlation of their activity values multiplied with the weights in the generic regulatory network.

