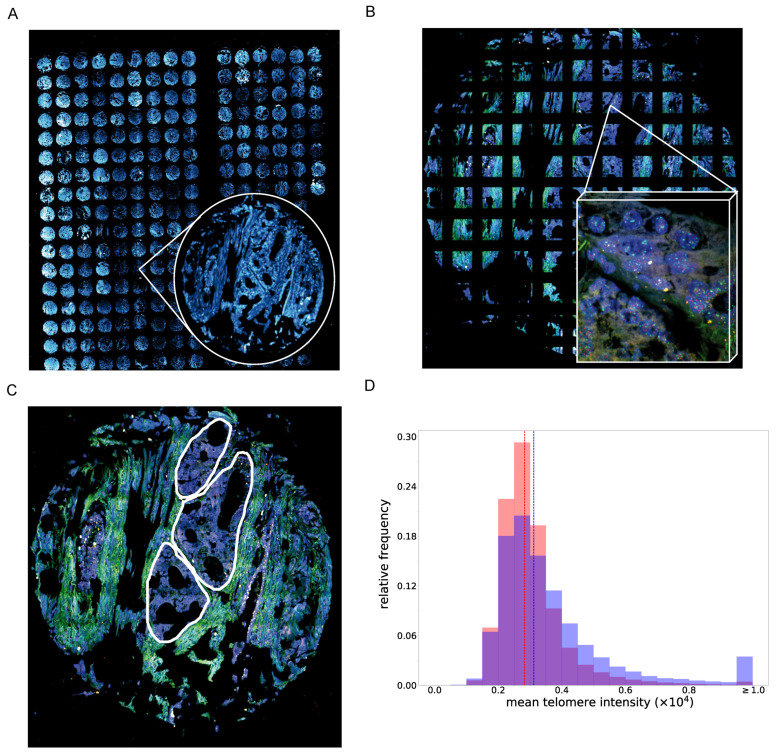
Figure 2.
Quantification of telomere length in PCa tissues based on an automated 3D imaging-based workflow. (A) Shows an overview of the analyzed TMA. From this TMA, 34 tissue slides of 17 patient samples were imaged representing three different patient sample cohorts: one cohort included all patient samples with a PITX1 status high and high Gleason Score (≥4 + 4), one cohort with PITX1 status low and high Gleason Score (≥4 + 4), and one with PITX1 status low and low Gleason Score (3 + 4). (B) For each core, tiled images were acquired and stitched together for the analysis. (C) To focus on the tumors, the tumor regions were manually marked by a pathologist. Only tumor regions were considered. (D) shows the distribution of mean telomere intensities of cells in samples with high (blue) versus negative (red) PITX1 levels, violet: overlapping events.

