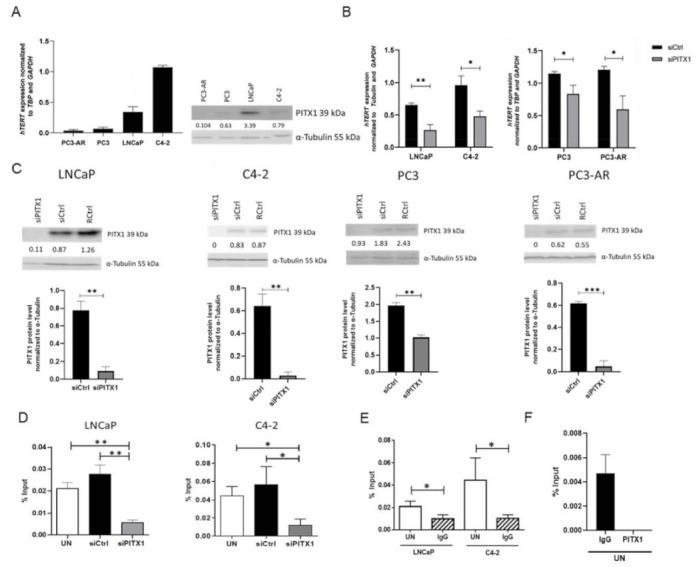
Figure 3.

PCa cell lines show divers TERT expression levels, decreased TERT expression and PITX1 TERT promoter binding upon PITX1 knockdown. (A) Endogenous TERT gene expression was quantified by qPCR in all investigated PCa cell lines, n = 3 biological replicates. For each cell line, a representative Western blot is shown. Numbers indicate the PITX1 protein band intensity normalized to α-tubulin. (B) TERT expression quantified by qPCR in non-targeting pool siRNA-transfected (siCtrl) or PITX1 targeting siRNA pool (siPITX1) transfected PCa cell lines. All cell lines express significantly lower TERT levels after PITX1 knockdown, n = 3 biological replicates. (C) Expression levels of PITX1 after siRNA knockdown (siPITX1) compared to a non-targeting siRNA pool (siCtrl). For each cell line, a representative Western Blot of siRNA knockdown is shown, including reagent control (siCtrl). Numbers indicate the PITX1 protein band intensity normalized to α-tubulin. In addition, a bar graph combining three biological replicates for each cell line is shown. All cell lines reveal a significant knockdown compared to the control. (D) ChIP against PITX1 was performed with either untreated (UN), non-targeting pool siRNA-transfected (siCtrl) or PITX1 targeting siRNA pool (siPITX1) transfected in LNCaP (left) and C4–2 (right) cells followed by qPCR. Significantly lower PITX1 binding to the −1.3 kb TERT promoter region compared to UN and siCtrl was obtained in the cells in which PITX1 was knocked down; LNCaP: n = 3 biological replicates; C4–2: n = 4 values for the statistics obtained from two biological replicates with two technical replicates each. (E) Significant binding of the PITX1 antibody in untreated (UN) LNCaP and C4–2 cells in comparison to IgG control (IgG) antibody at the −1.3 kb TERT promoter region, LNCaP: n = 3 biological replicates; C4–2: n = 4 values for the statistics obtained from two biological replicates with two technical replicates each. (F) Negative control of PITX1 hTERT promoter binding (−0.1kb region, no binding site of PITX1) in untreated (UN) LNCaP cells in comparison to IgG control (IgG). For the PITX1 antibody there was no detectable CT value after 40 PCR cycles, n = 3 biological replicates, shown are mean and standard deviation (p ≤ 0.05 *, p ≤ 0.01 ** and p ≤ 0.001 ***).
