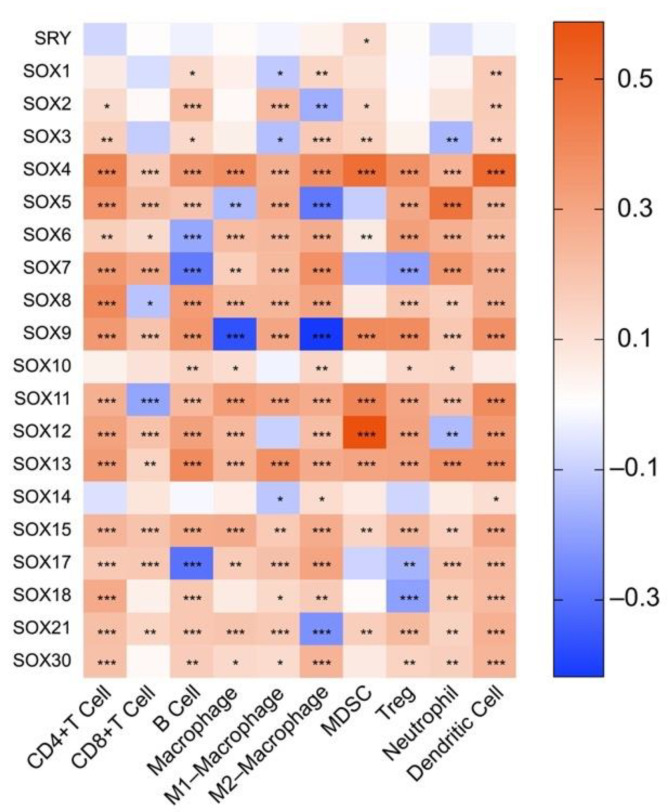
Figure 3.
The association heatmaps between SOX transcription factor expression and immune cell infiltration in hepatocellular carcinoma. Red indicates positive correlation, and blue indicates negative correlation. The darker the color, the stronger the correlation. The data was analyzed by the TIMER2. * p < 0.05, ** p < 0.01, *** p < 0.001.

