Figure 1.
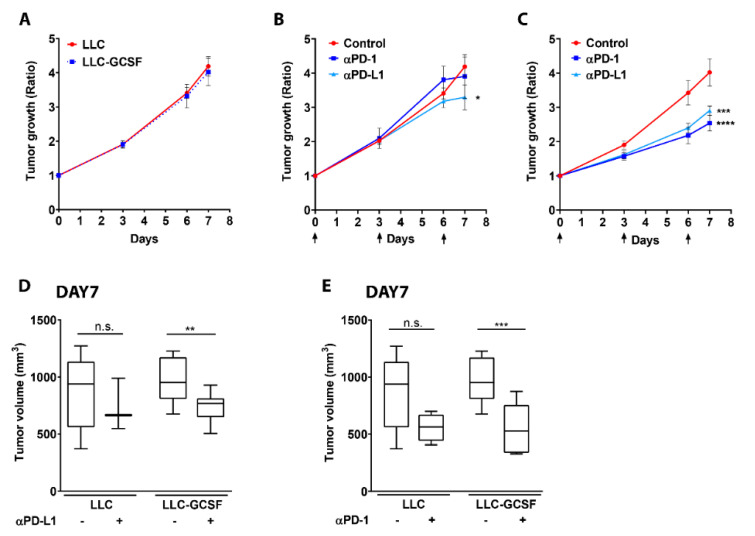
Impact of α-PD-L1 and α-PD-1 blockade on tumor progression of LLC vs. LLC-GCSF models. (A) LLC or LLC-GCSF cells were injected to the flank of mice. When tumors’ size reached 200–250 mm3, treatment was started (defined as day 0), and tumor size was monitored. Tumor growth ratio was calculated based on tumor size on each day vs. day 0. (B,C) Mice injected to the flank with either LLC (B) or LLC-GCSF (C) were treated with 250 µg α-PD-L1 or α-PD-1 antibodies. Days of treatments are marked by arrows. Tumor growth was monitored following treatments. (D,E) Tumor volume on day 7 for LLC and LLC-GCSF models is presented with or without α-PD-L1 (D) or α-PD-1 (E) treatment. Means values ± SE are shown, n = 3–12 in each group per experiment. Statistical differences between each treatment and the untreated control group are expressed with stars (*). Statistical significance was determined by one-way ANOVA with sidak’s post hoc test (B,C) or with unpaired two-tailed t-test (D,E), both with p < 0.05. * p < 0.05, ** p < 0.01, *** p < 0.001, **** p < 0.0001 and n.s—non-significant.

