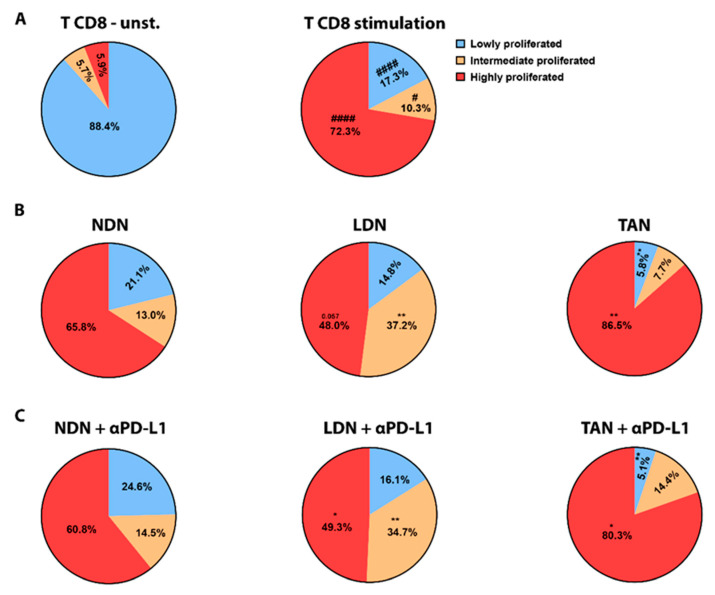
Figure 6.
The impact of α-PD-L1 treatment on neutrophil subpopulations’ ability to modulate CD8+ T cells proliferation. CD8+ T cell proliferation was quantified using CFSE labeling assay. The degree of proliferation in T cells was defined by separating whole CD8+ T cell population into 3 groups based on CFSE levels, i.e., low, intermediate and highly proliferated. (A) Stimulation with α-CD3 and α-CD28 induces proliferation (right panel) compared to (left panel) unstimulated cells (unst.) Statistical significance was determined by paired two-tailed t-test with p < 0.05 and is expressed with pound sign (#). # p < 0.05 and #### p < 0.0001. (B) CD8+ T cell proliferation was assessed following CD3/CD28 stimulation and co-culture with NDN, LDN, or TAN for 72 h (C) CD8+ T cell proliferation was assessed following CD3/CD28 stimulation and co-culture with NDN, LDN, or TAN for 72 h in the presence of α-PD-L1 antibody. Mean ± SE values are shown, n = 3–26. Statistical significance (B,C) was determined by one-way ANOVA with Dunnett post hoc corrections with p < 0.05. Differences between each co-culture settings, i.e., in the presence of each neutrophil subpopulation (B) and in the presence of α-PD-L1 (C), vs. CD8+ T cells alone activated with α-CD3 + α-CD8 control are expressed with stars (*). * p < 0.05, ** p < 0.01.

