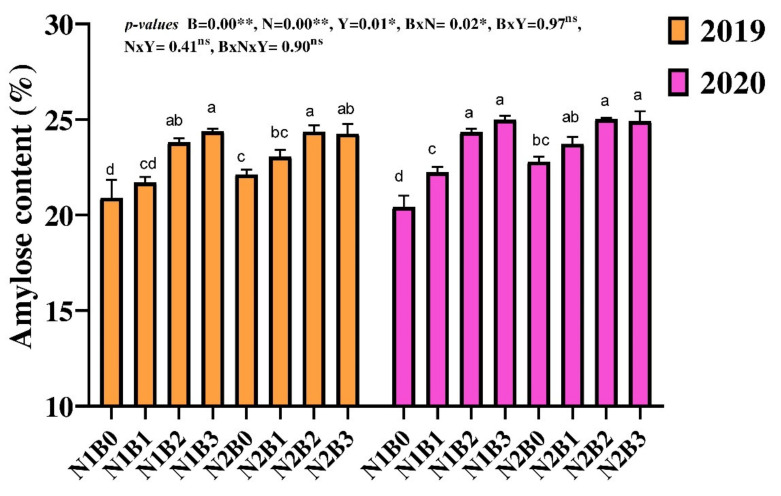
Figure 3.
Changes in amylose content of rice in response to different biochar and nitrogen fertilizer. Different letters above the column are significantly different from each paper. Bars represent the standard errors of the means. ** and * on the B, N, and Y indicate significance at the 0.01 and 0.05 probability levels, respectively. ns: non-significant. Columns with different letters are significantly different at p < 0.05. N1 and N2 represent 135 and 180 kg ha−1 nitrogen; B0, B1, B2, and B3 represent 0-, 10-, 20-, and 30-ton biochar ha−1.

