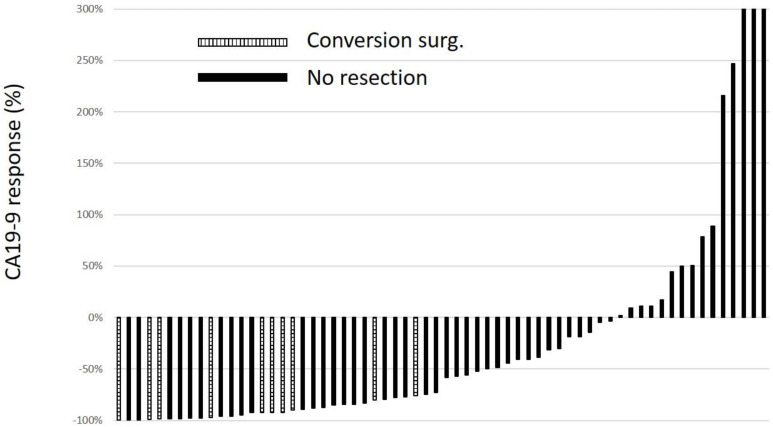
Figure 5.
Waterfall plot of serum CA19-9 response from baseline for primary treatment. The data represent the rate of CA19-9 response, calculated as [(post treatment value/baseline value) − 1] (%). All patients were within normal CA19-9 levels of pretreatment; patients for whom CA19-9 levels were evaluated only once were excluded.

