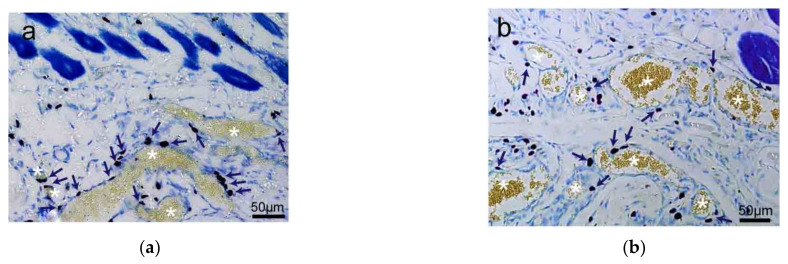
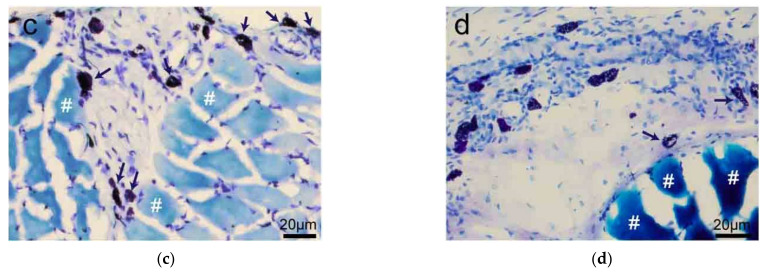
Figure 3.
The distribution of rat MCs along adipose and muscle tissues. (a,b) MCs are distributed along adipose tissue. Adipose tissue is dyed yellow with gathered particles and marked by white asterisks ‘*’ in the figures. (c,d) MCs are distributed along the muscle tissue. The muscle tissue is dyed blue or dark blue and marked by white pound signs ‘#’ in the figures. MCs around the tissue boundaries are marked with dark blue arrows, and the scale bar is shown in the lower right-hand corner of each examined figure. Based on Yang et al. (2018) [20], with permission from Ivyspring International Publisher.


