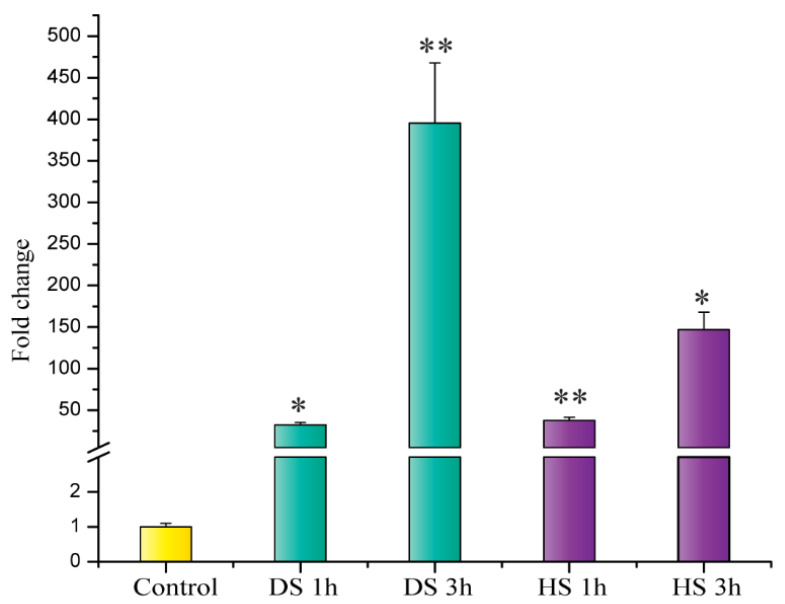
Figure 2.
Expression analysis of HVA1 under drought and heat stress conditions in Hordeum vulgare seedlings at different time points. Relative fold change was checked by qRT-PCR. Graph was plotted using three biological and three technical replicates. Error bars indicate values ± SD. Asterisks on the top of the error bars represent the significance value (Student’s t-test; p value ≤ 0.05 (marked *); p ≤ 0.01 (marked **)). (DS—Drought stress; HS—Heat stress).

