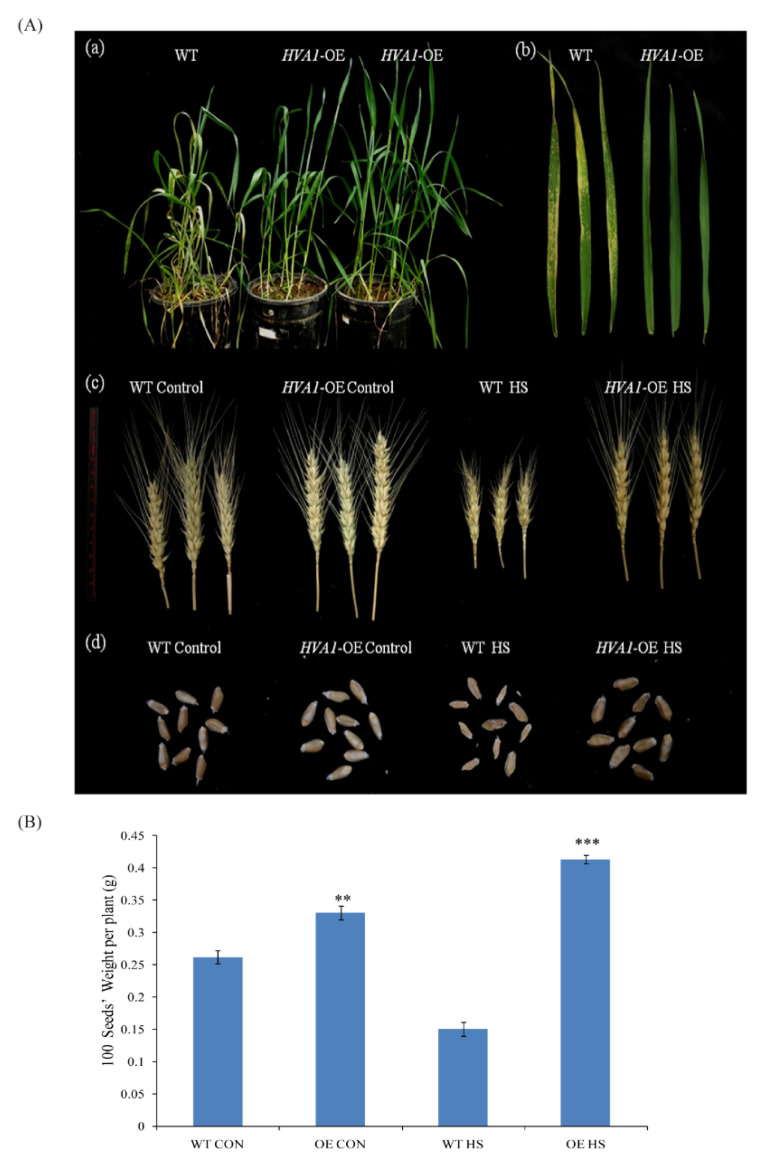
Figure 8.
(A)Phenotype of HVA1-overexpression wheat transgenic DH plants under heat stress at reproductive stage. (a) Photograph of the WT and transgenic DH plants (heading stage) after 2 days of recovery following heat stress. (b) Photograph of the WT and transgenic DH leaves showing the oxidative damage after recovery. (c) Photograph of the WT and transgenic DH spikes. (d) Photograph of the WT and transgenic DH spikes and seeds under control and heat stress conditions. (B) Graph representing seed weight of WT and transgenic DH plants under control and heat stress conditions. The data represent the mean ± SE of three biological replicates. Asterisks on the top of the error bars represent the significance value (Students t-test; p ≤ 0.01 (marked **); p ≤ 0.001 (marked ***)).

