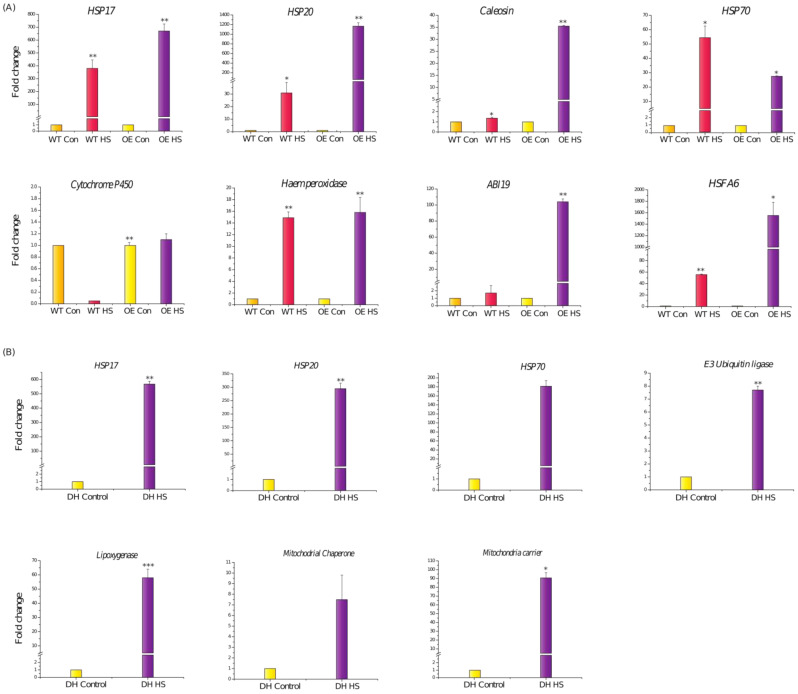
Figure 11.
(A) Validation and expression analysis of genes in WT and wheat transgenic DH plants under control and heat stress conditions at the vegetative stage. Expression was checked in the leaf tissue using qRT-PCR. (B) Validation and expression analysis of genes in transgenic wheat DH plants under control and heat stress conditions at the reproductive stage. Expression was checked in the spike tissue using qRT-PCR. Relative fold change was calculated. Graphs were plotted using three biological and three technical replicates. Error bars indicate values ± SD. Asterisks on the top of the error bars represent the significance value (Student’s t-test; p value ≤ 0.05 (marked *); p ≤ 0.01 (marked **); p ≤ 0.001 (marked ***)).

