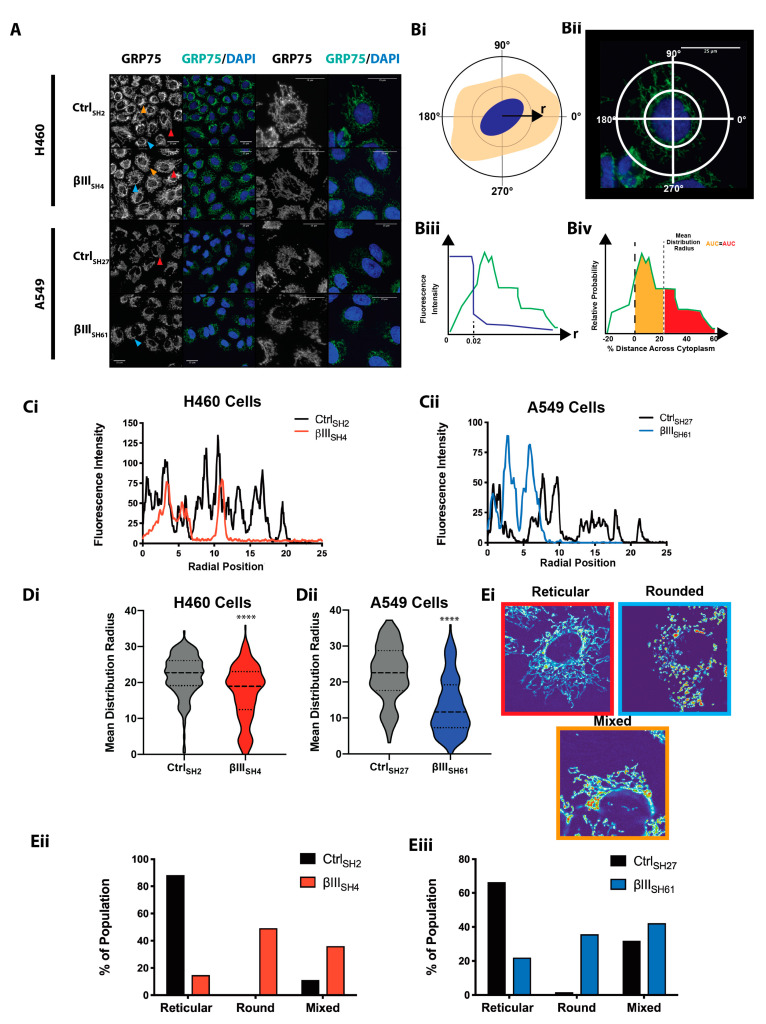
Figure 1.
βIII-tubulin regulates mitochondrial network structure and morphology. (A) Mitochondrial network distribution by GRP75 immunofluorescence staining (left panel: greyscale; right panel: GRP75 green, DAPI blue) in NCI-H460 and A549 cells expressing control (NCI-H460 CtrlSH2, A549 CtrlSH27) and βIII-tubulin targeted shRNA (NCI-H460 βIIISH4, A549 βIIISH61). Red arrowhead: reticular mitochondrial morphology; blue arrowhead: rounded morphology; orange arrowhead: mixed morphology. Scale bars 25um. Representative of n = 3 independent experiments. Pseudocolored images show signal intensity from low (blue) to high (red) with high magnification images in Supplementary Figure S1A. (B) Workflow overview to measure the distribution of mitochondrial throughout the cytoplasm. Signal intensities for individual cells are transformed into polar co-ordinates defined as a radial distance from the centre of the nucleus at a specific angle (Bi,Bii). The edge of the nucleus and cytoplasm is defined (Biii) and the signal intensity is scaled to 0 to 100% corresponding to the centre of the nucleus (0%) to the edge of the cytoplasm (100%), with the edge of the nucleus at 25%. The mean distribution radius is defined at the radial position, r, where the integrated relative probability of the signal is equal from between the nucleus and r and between the edge of the cytoplasm and r (Biv). (C) Representative fluorescence intensity profile of GRP75 expression from the edge of the nucleus in NCI-H460 (Ci) and A549 (Cii) cells. (D) Mitochondrial mean distribution radius in NCI-H460 (Di) and A549 (Dii) cells. **** p < 0.0001. Data from the analysis of 30–60 cells from each condition for each of n = 3 independent experiments. (Ei) Representative images of reticular, rounded and mixed mitochondrial morphologies. Signal intensity is pseudocolored as a thermal look up table to convey signal distribution. The proportion of cells with rounded, reticular or mixed mitochondrial morphology in NCI-H460 (Eii) and A549 (Eiii) cells. Data from 100 cells from three independent experiments.

