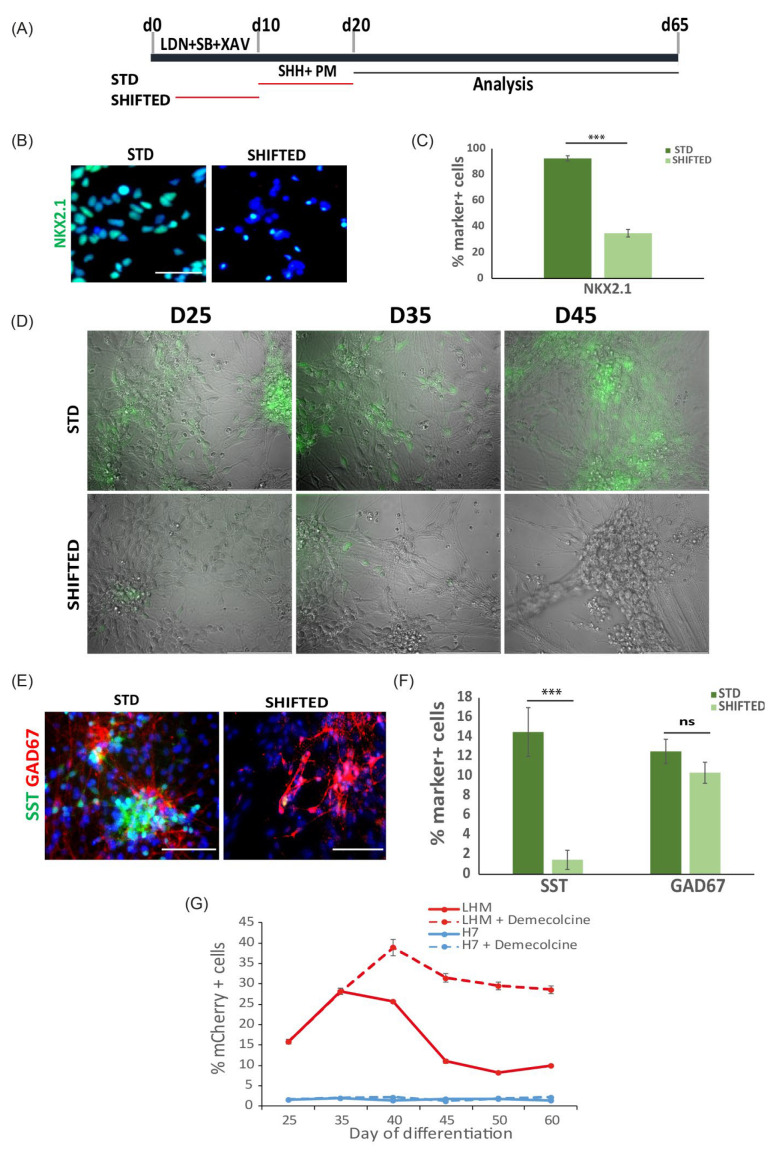
Figure 4.
Reporter expression response to inductive signals and other cues. (A) Illustration of standard and inductive cue ‘SHIFTED’ MGE differentiation paradigms. (B) Day 21 cultures stained for NKX2.1 with DAPI counter stain. (C) Quantification of NKX2.1+ cells. Data represent the mean ± SEM from three independent experiments, *** p < 0.001 two tailed unpaired t-test, equal variances and normal distribution tested. (D) Epifluorescence microscopy during MGE differentiation of LHE cells. (E) Double immunostaining for SST and GAD67 in STD and shifted conditions. (F) Quantification of SST+ and GAD67+ cells in E. n = 3; ns, p > 0.05, *** p < 0.001 two tailed unpaired t-test, equal variances and normal distribution tested. (G) Flow cytometry measurement of mCherry+ cells during 60-day differentiation under conditions indicated. Data are presented as mean ± SEM of three independent experiments. Scale bar in (B,E): 50 μm.

