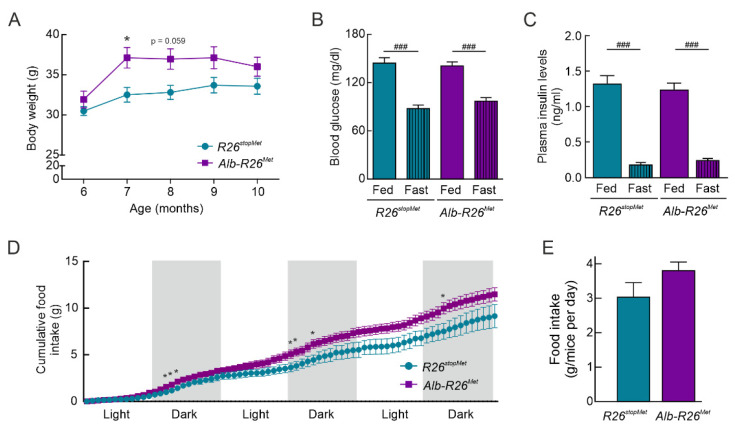
Figure 2.
Alb-R26Met mice present elevated body weight and food intake compared to R26stopMet controls. (A) Body weight evolution and total body weight gain of R26stopMet and Alb-R26Met mice (n = 10 and 19 mice per group, respectively). (B) Blood glucose levels (mg/dl) under fed and 16 h fasting conditions in R26stopMet and Alb-R26Met mice (n = 9 and 19 mice per group, respectively). (C) Plasma insulin levels (ng/mL) in fed (n = 4 and 14 mice per group, respectively) and 16 h fasted (n = 6 and 8 mice per group, respectively) conditions. (D) Cumulative food intake (g) of R26stopMet and Alb-R26Met mice (n = 6 and 10 mice per group, respectively). (E) Food intake (g) (n = 6 and 10 mice per group, respectively). Blood glucose, plasma insulin, and food intake were measured at the end of the experiment and, therefore, in 10 months old mice. (A–E) Values are mean ± SEM. For (A) and (D), statistical analysis was performed by fitting a mixed model followed by a Bonferroni post hoc test. For (B), statistical analysis was performed by a two-way ANOVA followed by a Bonferroni post hoc test. For (C) and (E), statistical analysis was performed according to a Student’s t test. * p < 0.05, ** p < 0.01, *** p< 0.001vs. R26stopMet mice. ### p < 0.001 vs. Fed condition.

