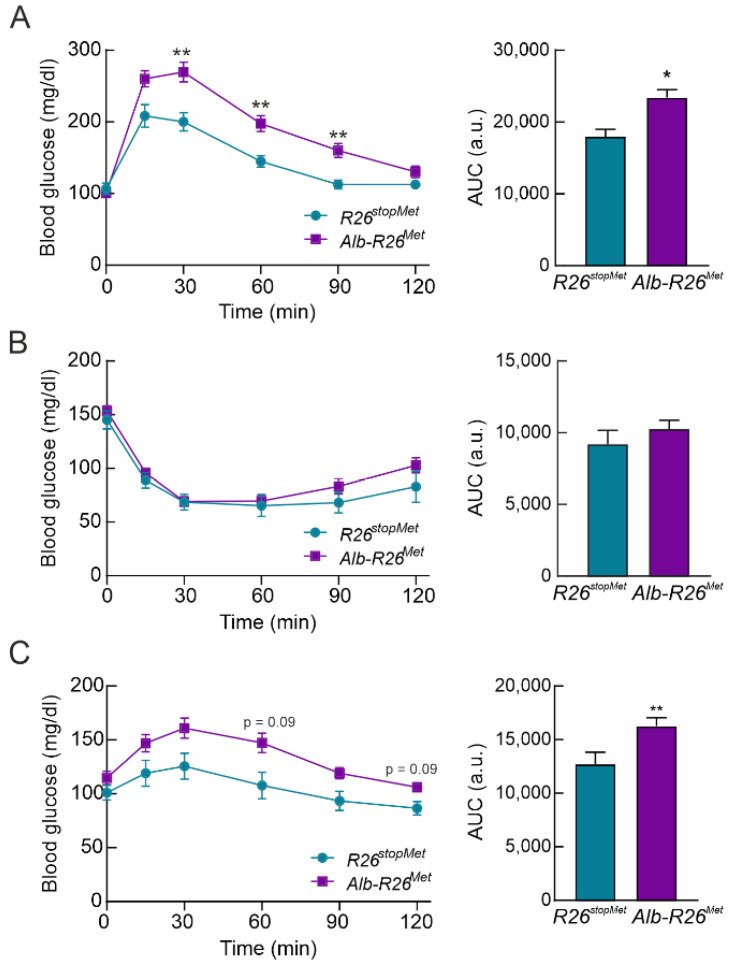
Figure 3.
Enhanced MET levels in hepatocytes impairs glucose homeostasis. (A) Glucose tolerance test (GTT) in R26stopMet and Alb-R26Met mice (n = 11 and 38 mice per group, respectively). Graph depicts the area under the curve (AUC) from GTT. (B) Insulin tolerance test (ITT) in R26stopMet and Alb-R26Met mice (n = 10 and 39 mice per group, respectively). Graph depicts AUC from ITT. (C) Pyruvate tolerance test (PTT) in R26stopMet and Alb-R26Met mice (n = 14 and 35 mice per group, respectively). Graph depicts AUC from PTT. (A–C) Values correspond to mean ± SEM. For time-course studies, statistical analysis was performed by a two-way repeated measures (RM) ANOVA followed by a Bonferroni post hoc test. For AUC, statistical analysis was performed according a Student’s t test. * p < 0.05, ** p < 0.01 vs. R26stopMet mice.

