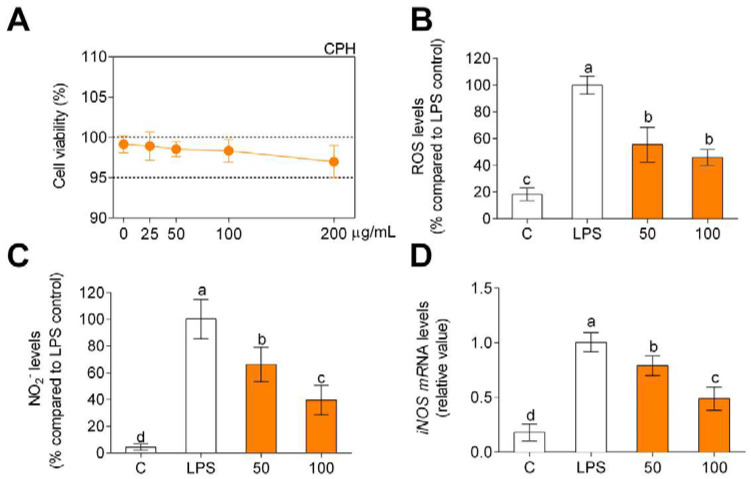
Figure 1.
Cell viability (A), production of ROS (B), and nitriles (C) expressed as fluorescence/absorbance and iNOS mRNA levels (D) compared to LPS-stimulated cells after CPH treatment at 50 and 100 μg/mL for 24 h in human primary monocytes. The values are presented as means ± SD (n = 3). Different letters denote statistical differences (p < 0.05).

