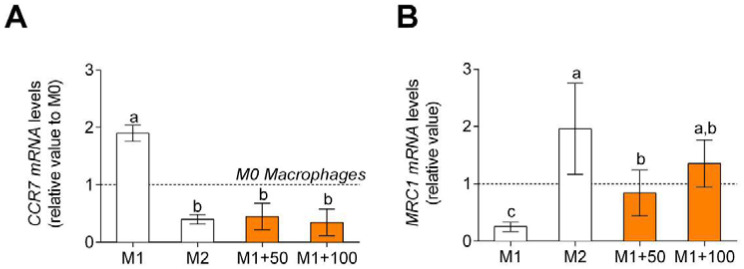
Figure 4.
Macrophage polarization marker gene expression, CCR7, M1 polarization marker (A) and MRC1, M2 polarization marker (B). M0 macrophages were incubated with LPS + IFNγ (M1 control), IL-4 (M2 control), or LPS + IFNγ + CPH (50 and 100 μg/mL for 24 h). Values are presented as means ± SD (n = 3). Different letters denote statistical differences (p < 0.05).

