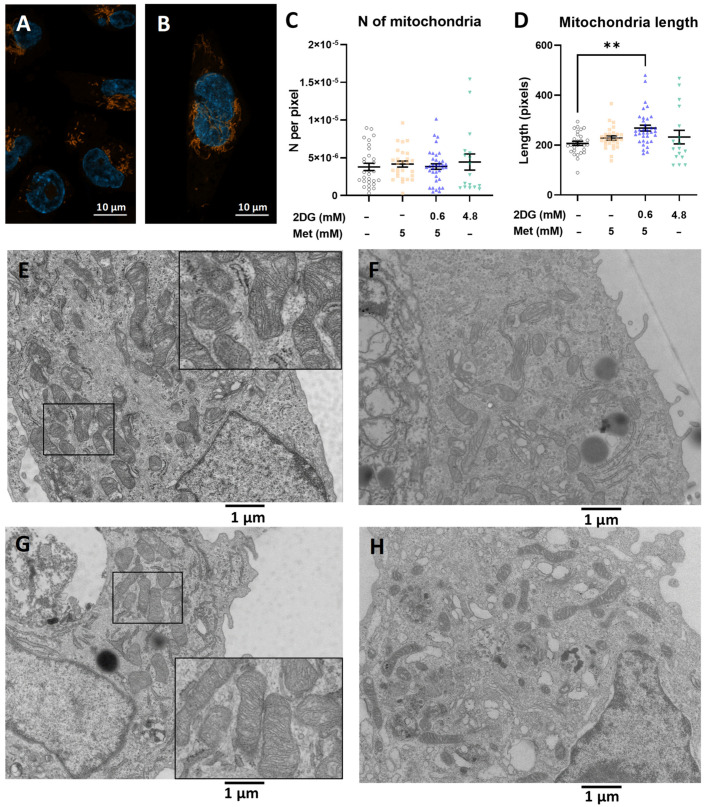
Figure 2.
The effect of metformin and 2DG on mitochondrial morphology in MDA-MB-231 cells. MDA-MB-231 cells were treated with 5 mM metformin and/or 0.6 mM 2DG or 4.8 mM 2DG for 72 h with daily medium change. (A,B) Representative fluorescence micrographs were captured after Mitotracker Orange and Hoechst 33342 staining. (C–H) Representative transmission electron micrographs were captured for 2 to 3 independent experiments, and (C) the number of mitochondria per surface area of cytoplasm and (D) mean length of mitochondria were determined. Each data point represents data from individual micrographs and horizontal bars indicate mean ± SEM. (E–H) Representative micrographs of (E) control, (F) 5 mM metformin-, (G) 5 mM metformin + 0.6 mM 2DG- and (H) 4.8 mM 2DG-treated cells at 3900× magnification. Scale bars indicate (A,B) 10 μm or (E–H) 1 μm. ** p < 0.01 as determined by ANOVA.

