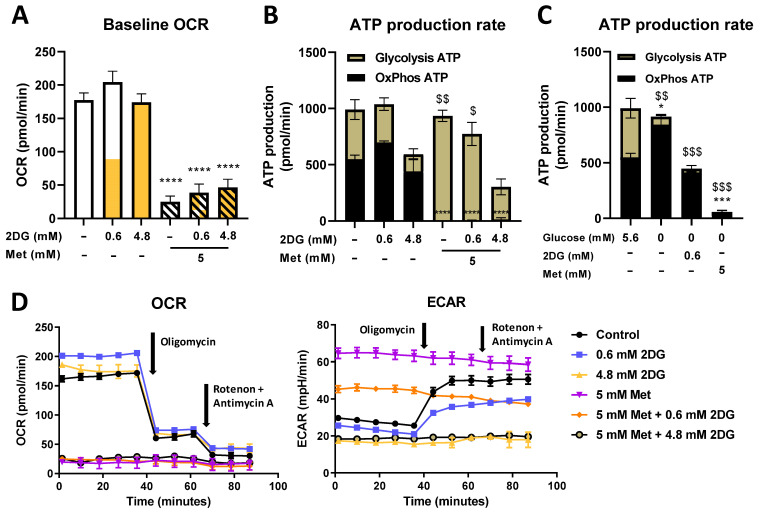
Figure 4.
The effect of metformin and 2DG on ATP production from glycolysis and oxidative phosphorylation. MDA-MB-231 cells were treated for 48 h with the indicated compounds in RPMI medium supplemented with (A,B,D) 5.6 mM or (C) 0 mM glucose as indicated, with daily medium change. Following treatment, the oxygen consumption rate (OCR) and extracellular acidification rate (ECAR) were measured with Seahorse XFe24 analyzer using the Real Time ATP Production Assay. The results were corrected for relative cell number as determined by Hoechst staining. (A) Baseline OCR. (B,C) ATP production from oxidative phosphorylation and glycolysis was calculated according to the manufacturer’s instructions. (D) Representative OCR and ECAR timelines. The mean ± SEM for three independent experiments is shown. Data is color-coded according to treatment. **** p < 0.0001 as determined by ANOVA. For ATP production (B,C), * p < 0.05, *** p < 0.001, **** p < 0.0001 as determined by ANOVA for OxPhos ATP production; $ p < 0.05, $$ p < 0.01, $$$ p < 0.001 as determined by ANOVA for glycolytic ATP production.

