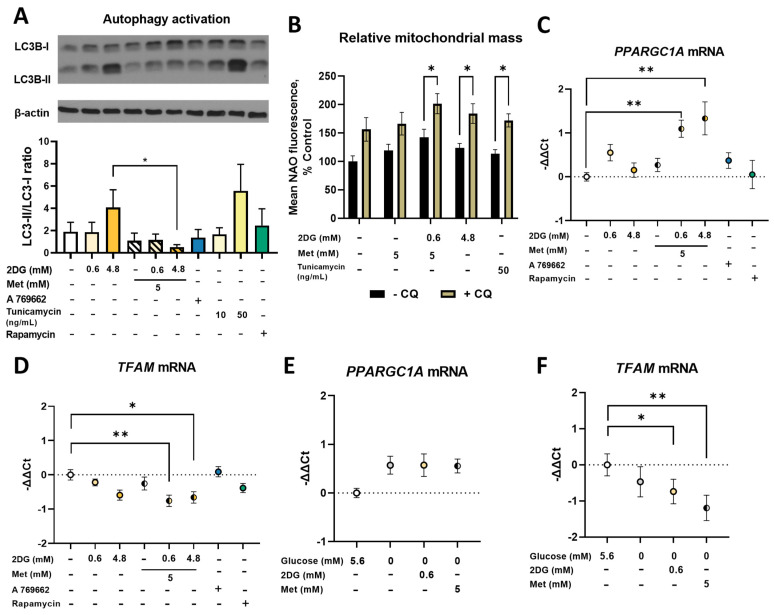
Figure 5.
The effect of metformin and 2DG on mitochondrial biogenesis and autophagy. MDA-MB-231 cells were grown in the RPMI medium supplemented with (A–D) 5.6 mM or (E,F) 0 mM glucose and treated with indicated compounds for (A,C–G) 24 h or (B) 72 h. (A) The ratio of LC3-II to LC3-I was determined by Western blot. (C,D) Mean expression levels for (C,E) PPARGC1A mRNA and (D,F) TFAM mRNA were determined wit qRT-PCR. (B) MDA-MB-231 cells were treated with 4.8 mM 2DG or 5 mM metformin ± 0.6 mM 2DG in the presence or absence of 40 μM chloroquine (CQ) for 72 h with daily medium change and the mitochondrial mass determined with NAO staining. The mean ± SEM is shown for 3–4 independent experiments. Data is color-coded according to treatment (orange for 2DG, blue for A 769662, green for rapamycin, yellow for tunicamycin and hatching for metformin). * p < 0.05, ** p < 0.01 as determined by ANOVA. (Figure S11 Original western blot images).

