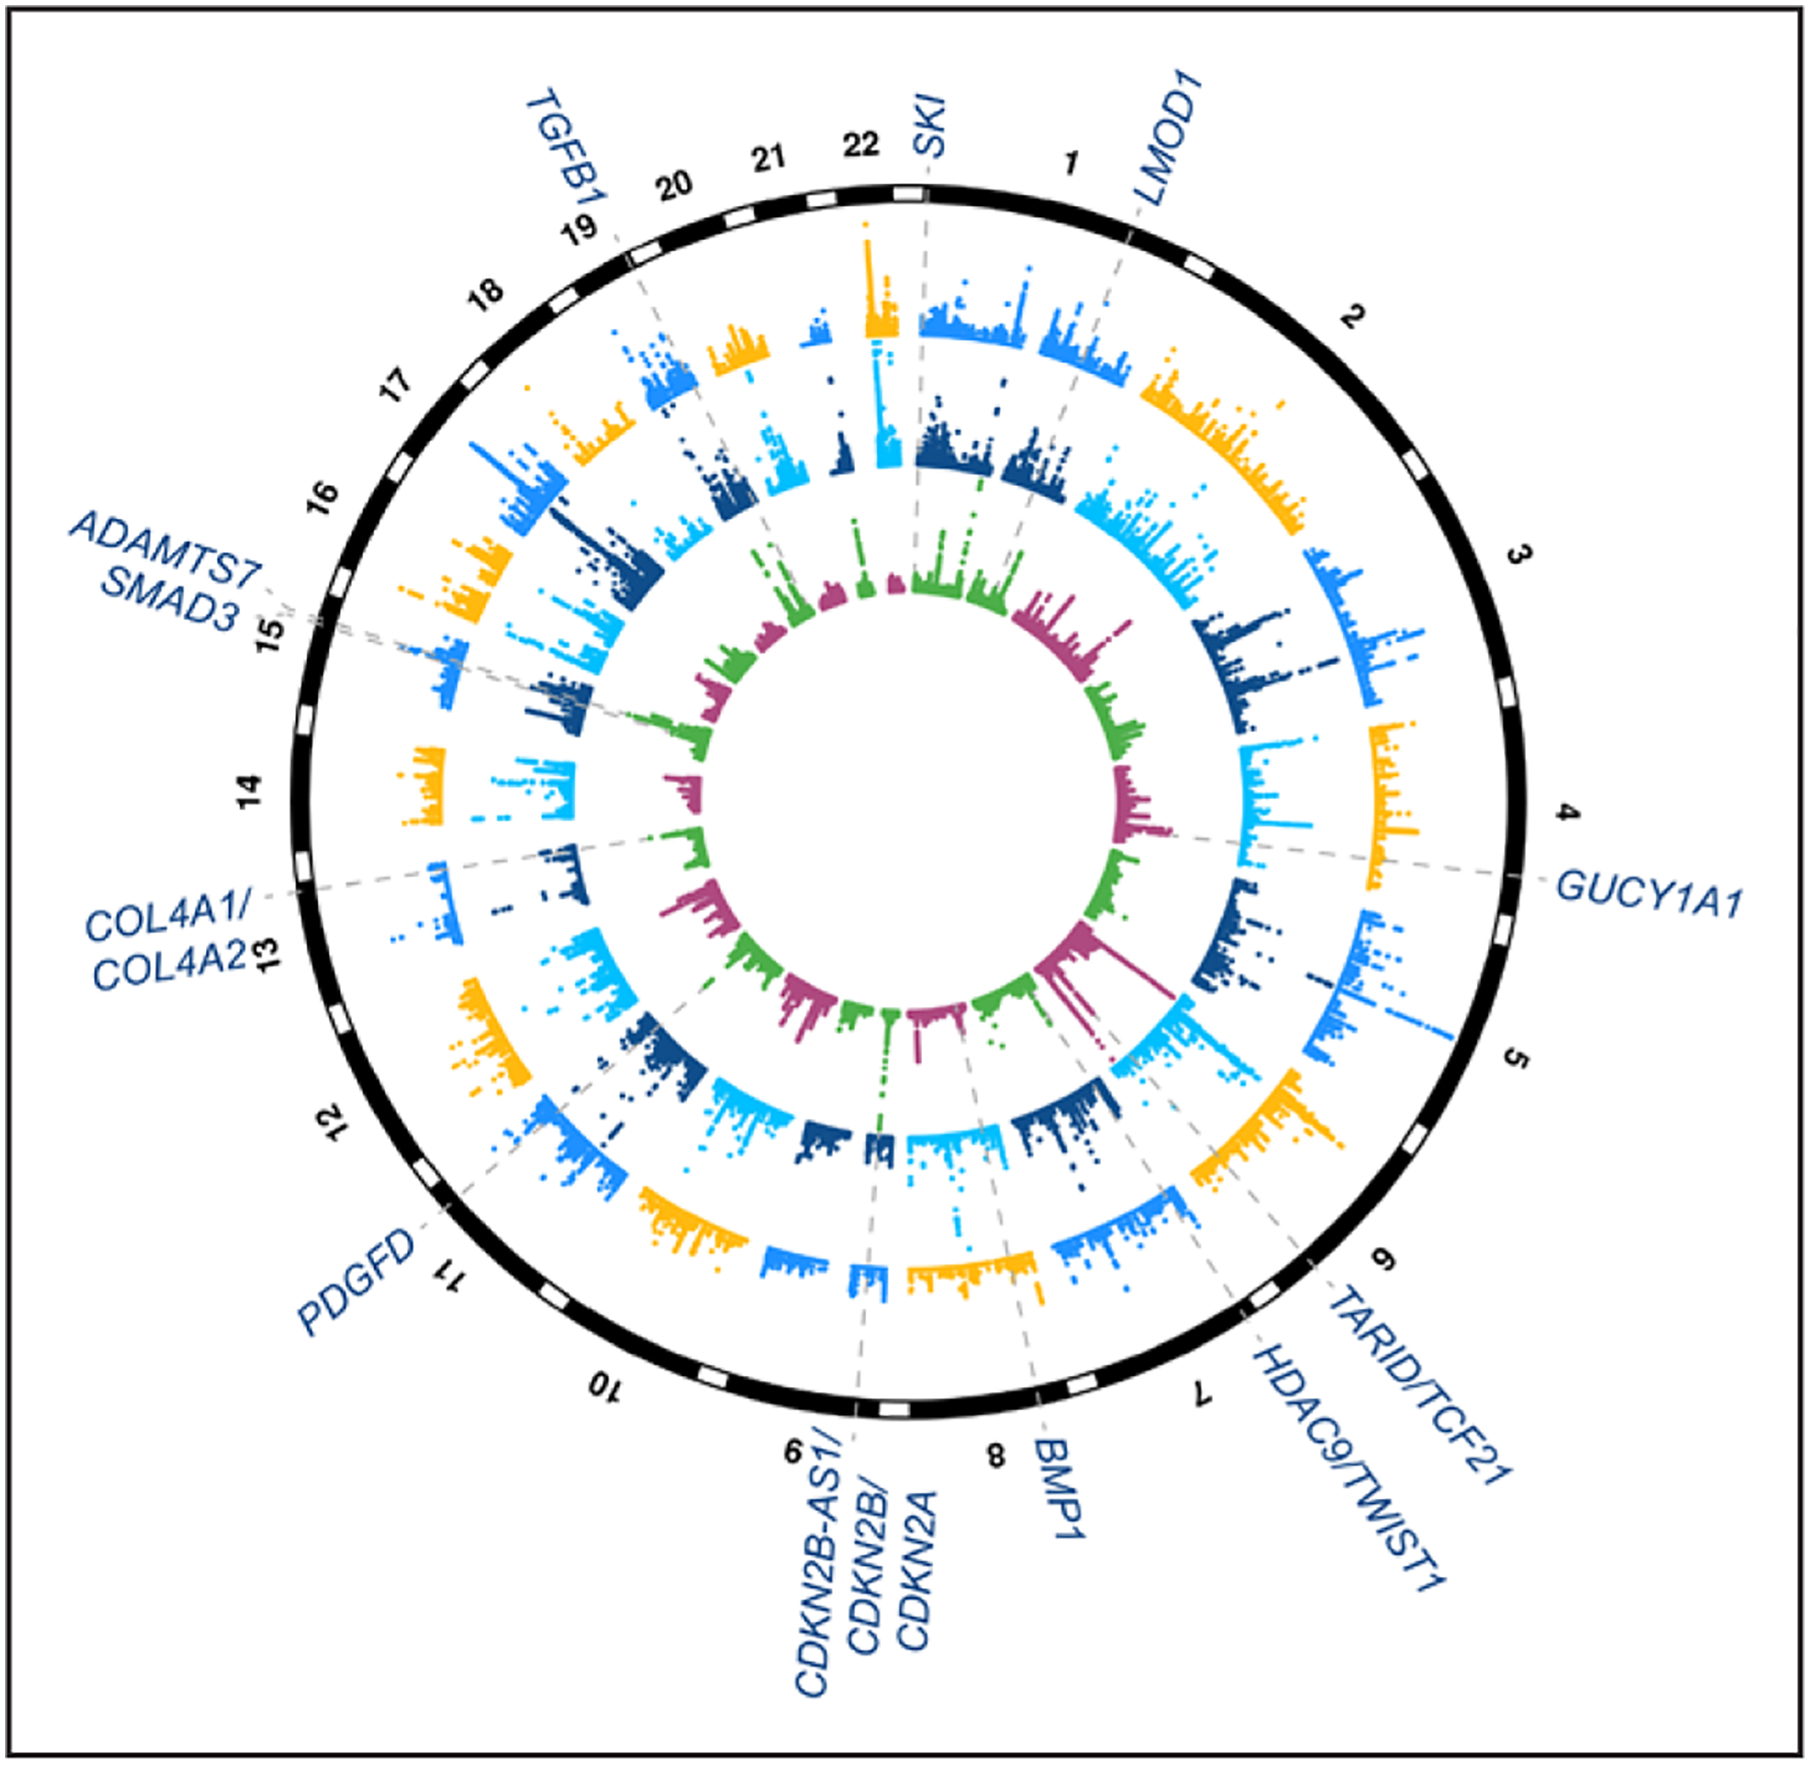
Figure 1.

Summary of coronary artery disease (CAD) genome-wide association study (GWAS) and expression quantitative trait locus (eQTL) targeting genes with evidence of smooth muscle functions. Circular Manhattan plot depicting genome-wide significant loci associated with CAD from meta-analyses of CARDIoGRAMplusC4D (Coronary Artery Disease Genome Wide and Replication and Meta-Analysis Plus The Coronary Artery Disease Genetics Consortium) and UK Biobank data.7 Inner circle shows −log10 P values for CAD GWAS loci (maximum set to 50), and dashed lines and text highlight candidate causal genes with evidence of smooth muscle cell functions.28–38 Middle circle shows −log10 P values for eQTLs (maximum set to 100) identified from tibial artery in Genotype-Tissue Expression (GTEx; largest sample size for artery samples in this database) and outer circle shows −log10 P values for liver eQTLs (maximum set to 30) in GTEx. Note: these candidate target genes are based on existing experimental studies in the literature and may be subject to change with additional statistical and/or functional fine-mapping efforts.
