
Table 1.
Patient flow and SBIRT activity counts
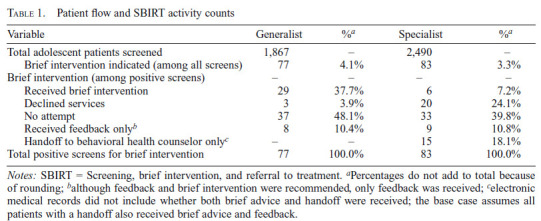
| Variable | Generalist | %a | Specialist | %a |
|---|---|---|---|---|
| Total adolescent patients screened | 1,867 | - | 2,490 | - |
| Brief intervention indicated (among all screens) | 77 | 4.1% | 83 | 3.3% |
| Brief intervention (among positive screens) | - | - | - | - |
| Received brief intervention | 29 | 37.7% | 6 | 7.2% |
| Declined services | 3 | 3.9% | 20 | 24.1% |
| No attempt | 37 | 48.1% | 33 | 39.8% |
| Received feedback onlyb | 8 | 10.4% | 9 | 10.8% |
| Handoff to behavioral health counselor onlyc | - | - | 15 | 18.1% |
| Total positive screens for brief intervention | 77 | 100.0% | 83 | 100.0% |
Notes: SBIRT = Screening, brief intervention, and referral to treatment.
a
Percentages do not add to total because of rounding;
b
although feedback and brief intervention were recommended, only feedback was received;
c
electronic medical records did not include whether both brief advice and handoff were received; the base case assumes all patients with a handoff also received brief advice and feedback.