
Table 3.
Univariate models separated by UPPS-P and context facets
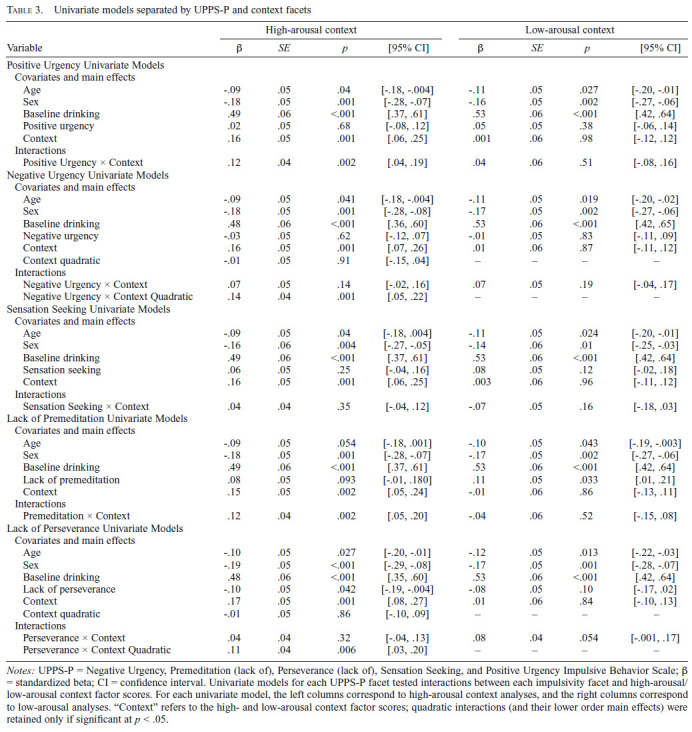
| Variable | High-arousal context | Low-arousal context | ||||||
|---|---|---|---|---|---|---|---|---|
| β | SE | p | [95% CI] | β | SE | p | [95% CI] | |
| Positive Urgency Univariate Models | ||||||||
| Covariates and main effects | ||||||||
| Age | −.09 | .05 | .04 | [−.18, −.004] | −.11 | .05 | .027 | [−.20, −.01] |
| Sex | −.18 | .05 | .001 | [−.28, −.07] | −.16 | .05 | .002 | [−.27, −.06] |
| Baseline drinking | .49 | .06 | <.001 | [.37, .61] | .53 | .06 | <.001 | [.42, .64] |
| Positive urgency | .02 | .05 | .68 | [−.08, .12] | .05 | .05 | .38 | [−.06, .14] |
| Context | .16 | .05 | .001 | [.06, .25] | .001 | .06 | .98 | [−.12, .12] |
| Interactions | ||||||||
| Positive Urgency × Context | .12 | .04 | .002 | [.04, .19] | .04 | .06 | .51 | [−.08, .16] |
| Negative Urgency Univariate Models | ||||||||
| Covariates and main effects | ||||||||
| Age | −.09 | .05 | .041 | [−.18, −.004] | −.11 | .05 | .019 | [−.20, −.02] |
| Sex | −.18 | .05 | .001 | [−.28, −.08] | −.17 | .05 | .002 | [−.27, −.06] |
| Baseline drinking | .48 | .06 | <.001 | [.36, .60] | .53 | .06 | <.001 | [.42, .65] |
| Negative urgency | −.03 | .05 | .62 | [−.12, .07] | −.01 | .05 | .83 | [−.11, .09] |
| Context | .16 | .05 | .001 | [.07, .26] | .01 | .06 | .87 | [−.11, .12] |
| Context quadratic | −.01 | .05 | .91 | [−.15, .04] | - | - | - | - |
| Interactions | ||||||||
| Negative Urgency × Context | .07 | .05 | .14 | [−.02, .16] | .07 | .05 | .19 | [−.04, .17] |
| Negative Urgency × Context Quadratic | .14 | .04 | .001 | [.05, .22] | - | - | - | - |
| Sensation Seeking Univariate Models | ||||||||
| Covariates and main effects | ||||||||
| Age | −.09 | .05 | .04 | [−.18, .004] | −.11 | .05 | .024 | [−.20, −.01] |
| Sex | −.16 | .06 | .004 | [−.27, −.05] | −.14 | .06 | .01 | [−.25, −.03] |
| Baseline drinking | .49 | .06 | <.001 | [.37, .61] | .53 | .06 | <.001 | [.42, .64] |
| Sensation seeking | .06 | .05 | .25 | [−.04, .16] | .08 | .05 | .12 | [−.02, .18] |
| Context | .16 | .05 | .001 | [.06, .25] | .003 | .06 | .96 | [−.11, .12] |
| Interactions | ||||||||
| Sensation Seeking × Context | .04 | .04 | .35 | [−.04, .12] | −.07 | .05 | .16 | [−.18, .03] |
| Lack of Premeditation Univariate Models | ||||||||
| Covariates and main effects | ||||||||
| Age | −.09 | .05 | .054 | [−.18, .001] | −.10 | .05 | .043 | [−.19, −.003] |
| Sex | −.18 | .05 | .001 | [−.28, −.07] | −.17 | .05 | .002 | [−.27, −.06] |
| Baseline drinking | .49 | .06 | <.001 | [.37, .61] | .53 | .06 | <.001 | [.42, .64] |
| Lack of premeditation | .08 | .05 | .093 | [−.01, .180] | .11 | .05 | .033 | [.01, .21] |
| Context | .15 | .05 | .002 | [.05, .24] | −.01 | .06 | .86 | [−.13, .11] |
| Interactions | ||||||||
| Premeditation × Context | .12 | .04 | .002 | [.05, .20] | −.04 | .06 | .52 | [−.15, .08] |
| Lack of Perseverance Univariate Models | ||||||||
| Covariates and main effects | ||||||||
| Age | −.10 | .05 | .027 | [−.20, −.01] | −.12 | .05 | .013 | [−.22, −.03] |
| Sex | −.19 | .05 | <.001 | [−.29, −.08] | −.17 | .05 | .001 | [−.28, −.07] |
| Baseline drinking | .48 | .06 | <.001 | [.35, .60] | .53 | .06 | <.001 | [.42, .64] |
| Lack of perseverance | −.10 | .05 | .042 | [−.19, −.004] | −.08 | .05 | .10 | [−.17, .02] |
| Context | .17 | .05 | .001 | [.08, .27] | .01 | .06 | .84 | [−.10, .13] |
| Context quadratic | −.01 | .05 | .86 | [−.10, .09] | - | - | - | H- |
| Interactions | ||||||||
| Perseverance × Context | .04 | .04 | .32 | [−.04, .13] | .08 | .04 | .054 | [−.001, .17] |
| Perseverance × Context Quadratic | .11 | .04 | .006 | [.03, .20] | - | - | - | - |
Notes: UPPS-P = Negative Urgency, Premeditation (lack of), Perseverance (lack of), Sensation Seeking, and Positive Urgency Impulsive Behavior Scale; β = standardized beta; CI = confidence interval. Univariate models for each UPPS-P facet tested interactions between each impulsivity facet and high-arousal/low-arousal context factor scores. For each univariate model, the left columns correspond to high-arousal context analyses, and the right columns correspond to low-arousal analyses. “Context” refers to the high- and low-arousal context factor scores; quadratic interactions (and their lower order main effects) were retained only if significant at p < .05.