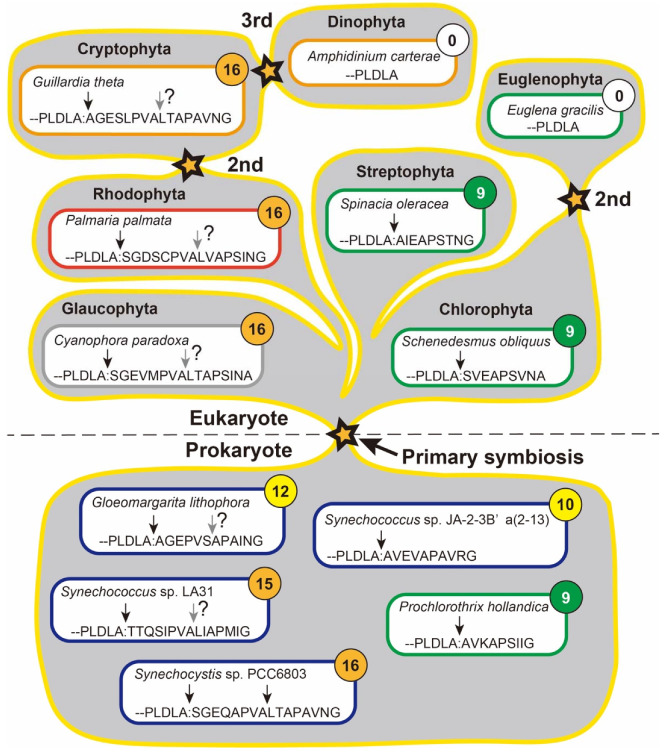
Figure 4.
Variations on the C-terminal extension sequences and distribution of the variety on the schematic tree of the evolutionary history of plastid-bearing organisms. Rounded rectangles represent typical organisms in the groups. The scientific names of each organism are shown in the upper row, and its C-terminal sequence of pD1 is indicated in the lower row. The downward arrows mean the cleavage site of the CtpA. Gray arrows with question marks indicate potential cleavage sites without experimental confirmation. The numbers in the circles of each organism are lengths of the C-terminal extension. Stars mean symbiotic events.

