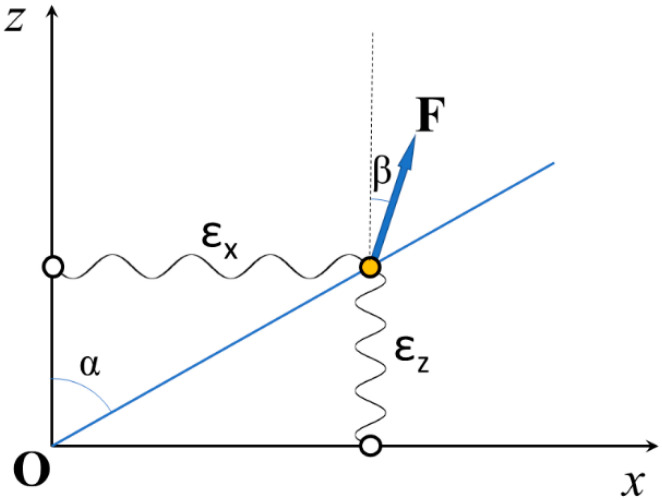
Figure 1.
Schematic 2D representation of an elastic element with different stiffness values εx and εz along the x and z directions, respectively. The blue line at angle α with the z axis represents the structural constraint for the movement of the tip of the element (orange circle) when force F (blue arrow) is applied.

